
- Audience Metrics
- Audience Overlap
- Audience Trends
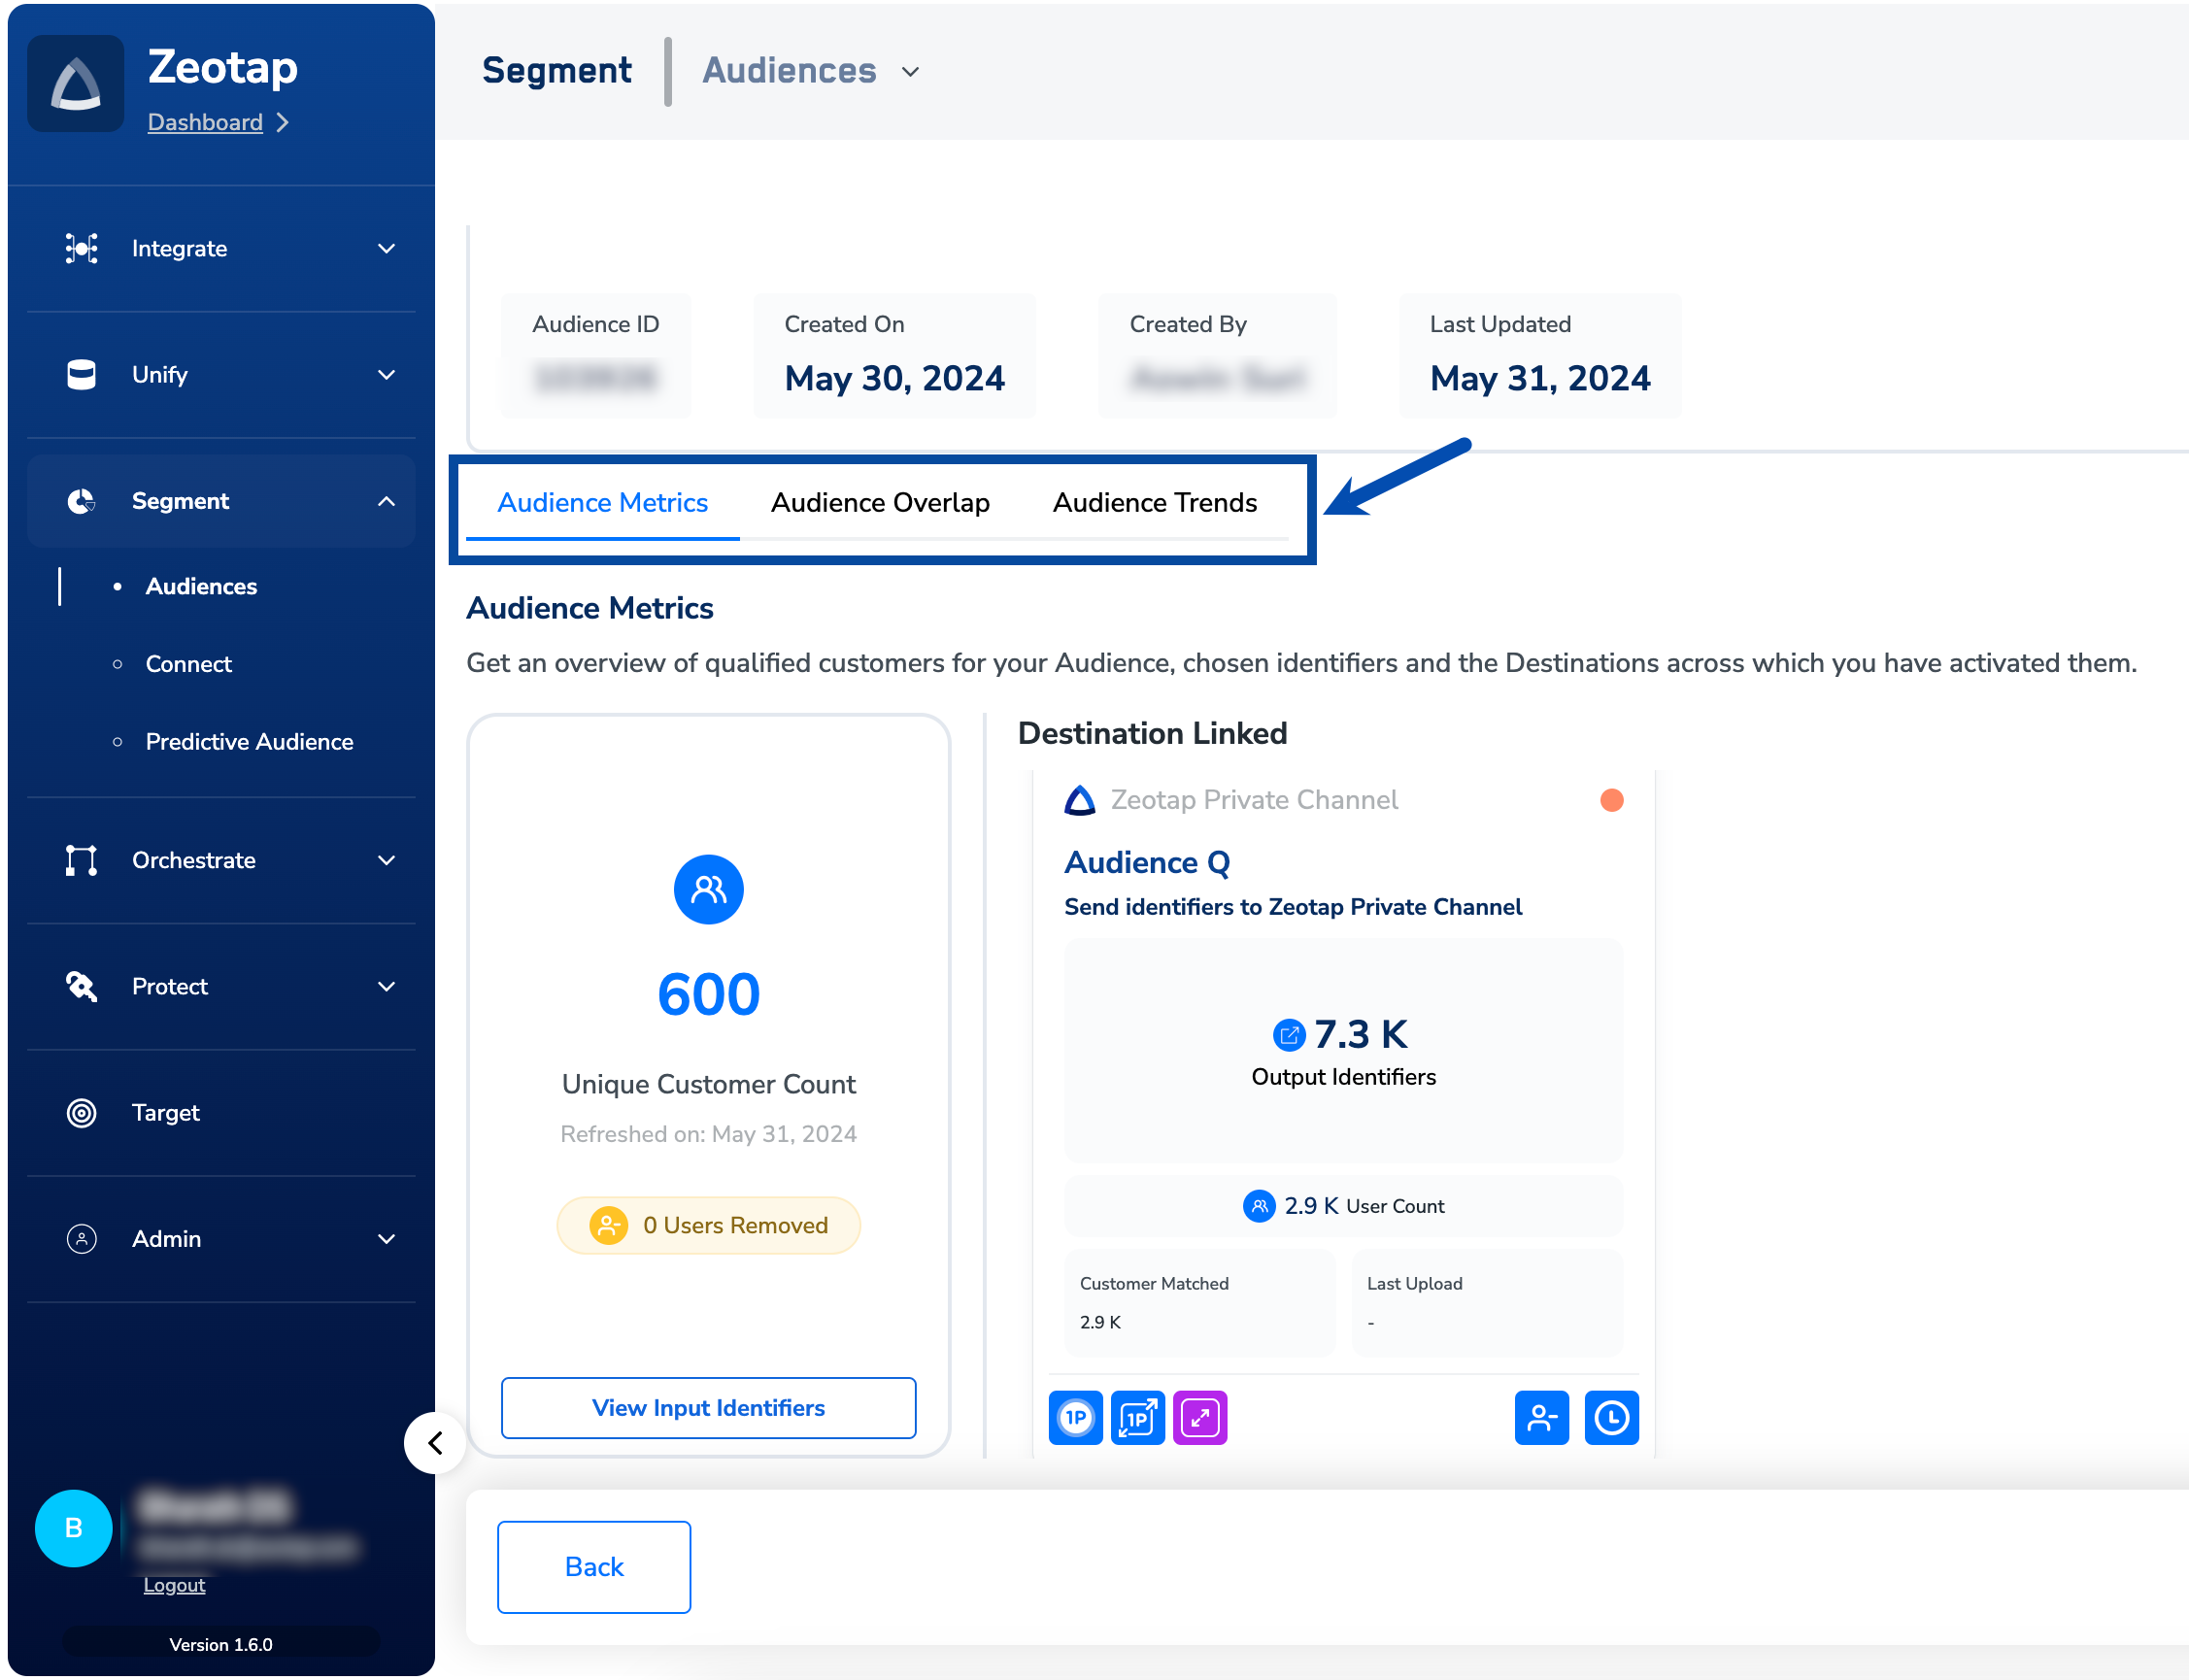
Audience Metrics
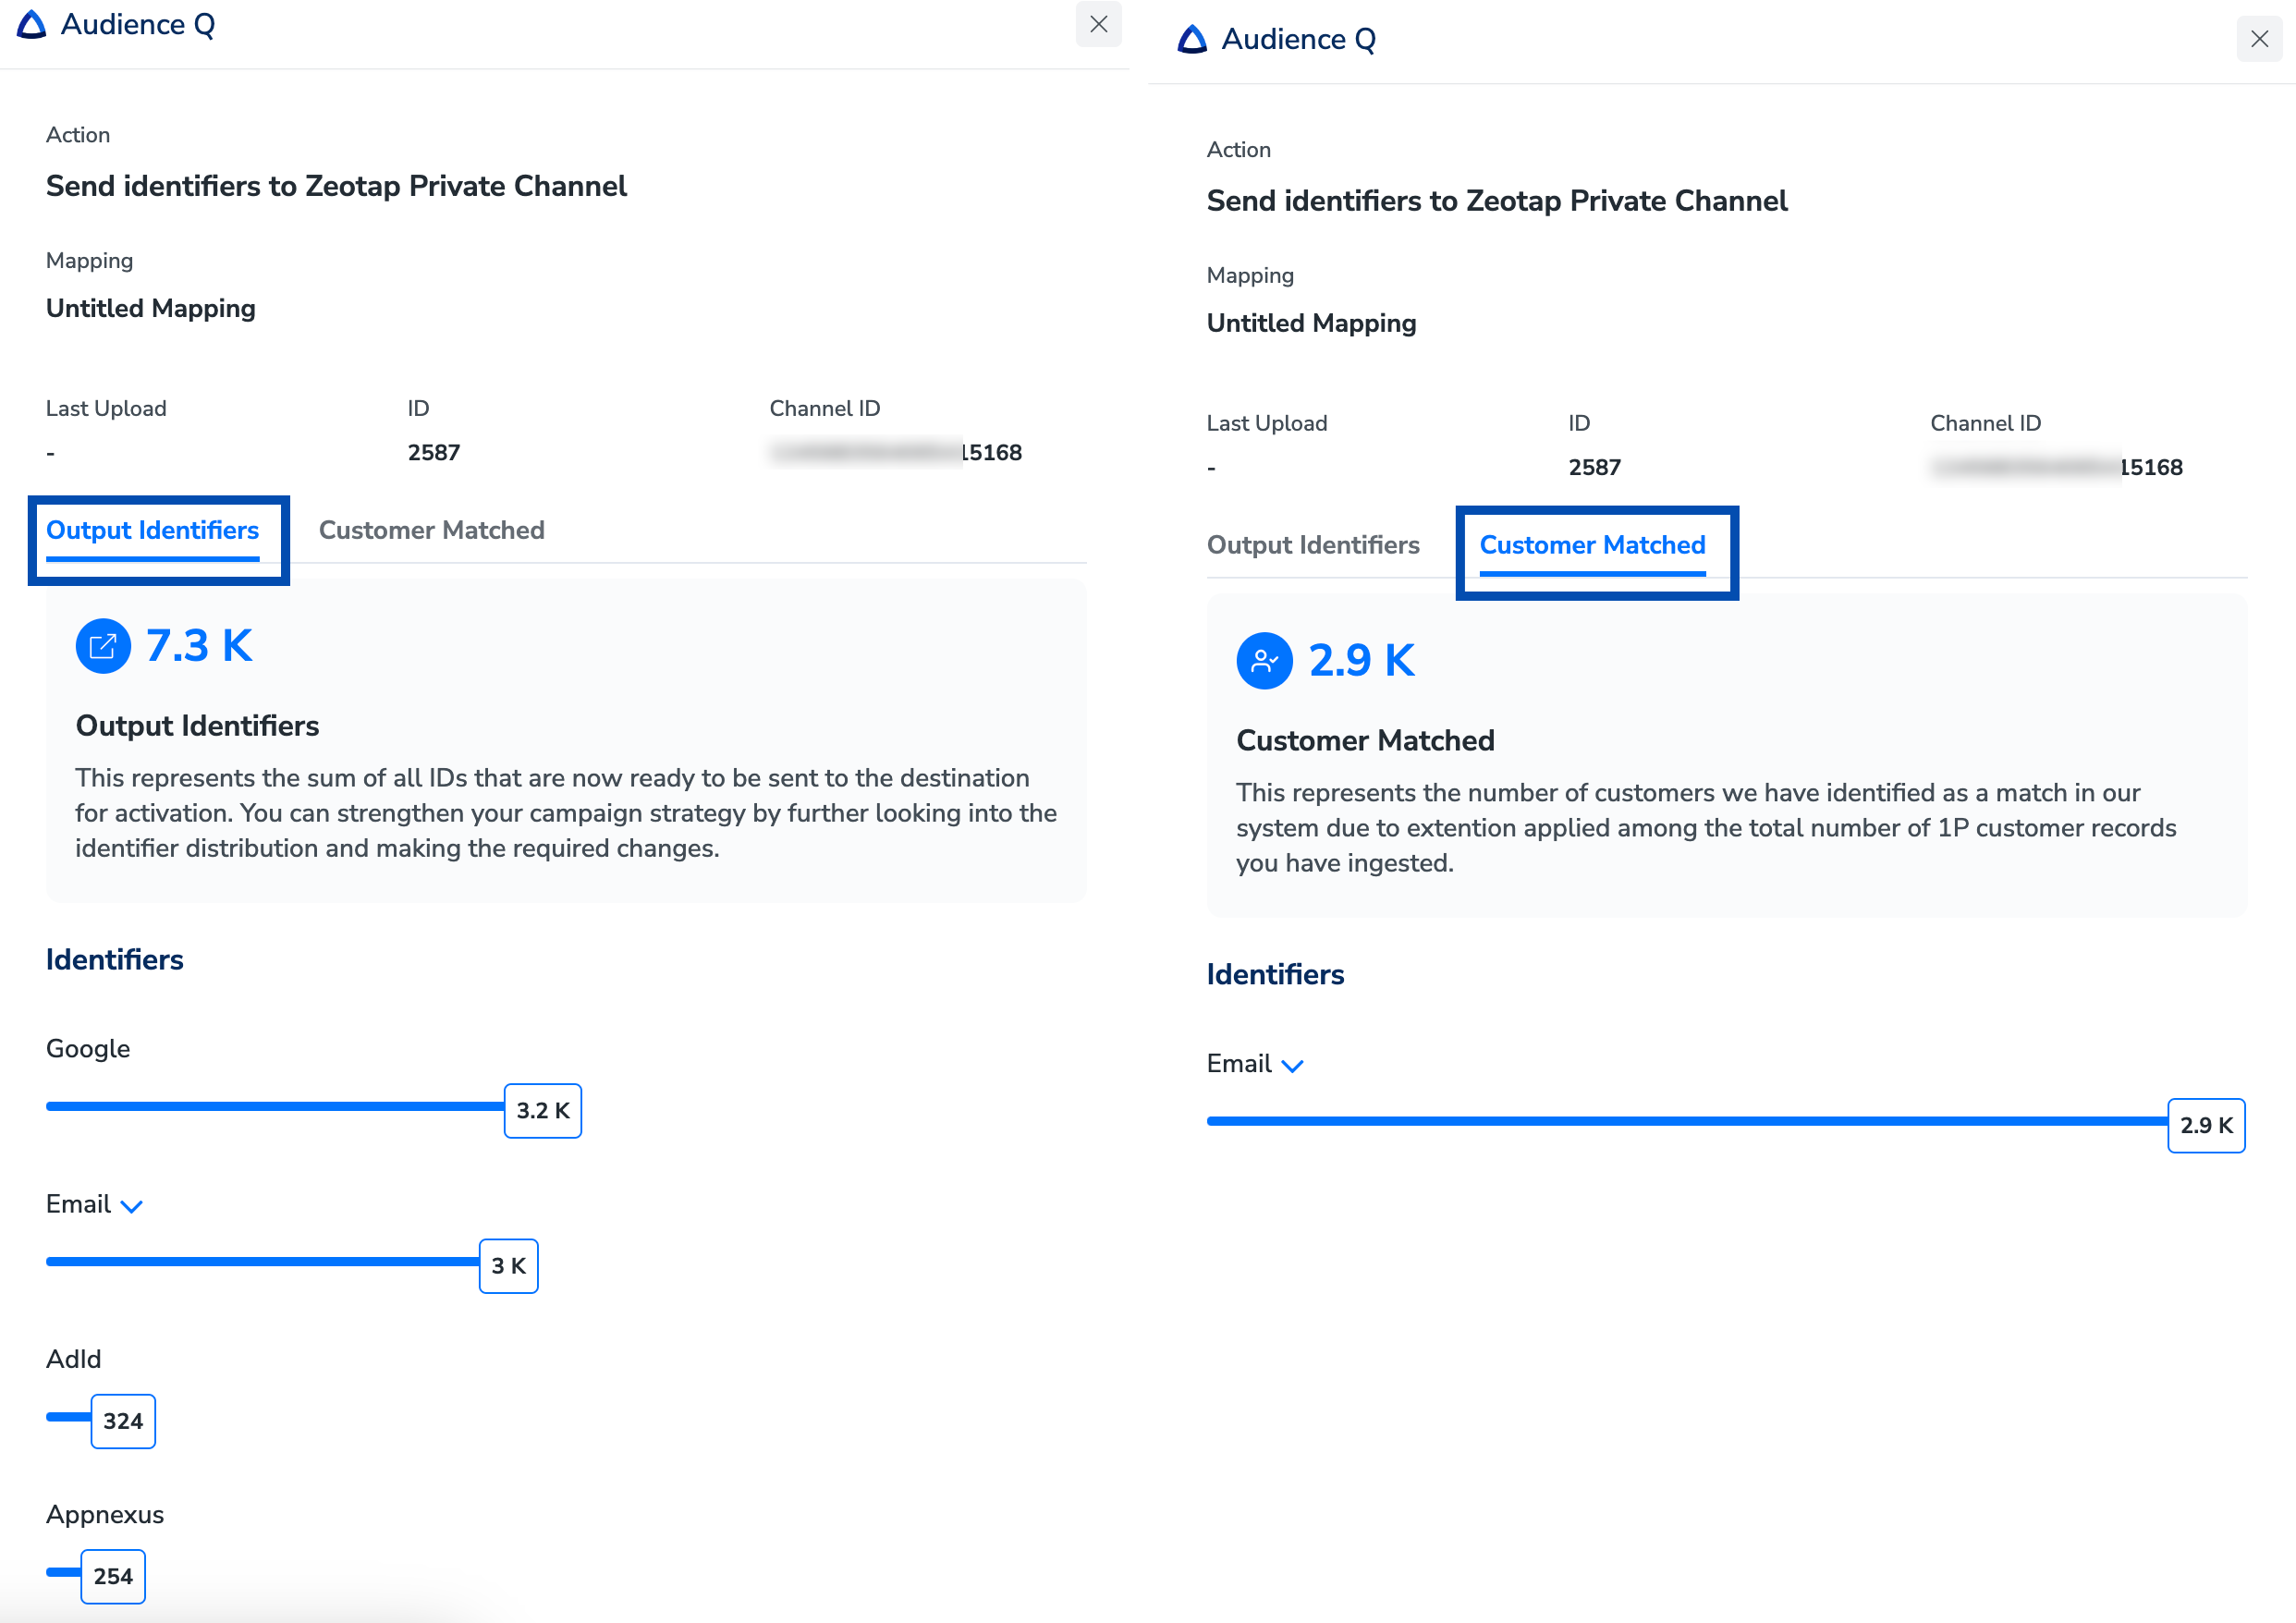
In the Audience Metricstab, you can get an overview of the Unique Customer Count along with the detailed breakup of the Identifiers chosen and the Destinations across which you have activated them.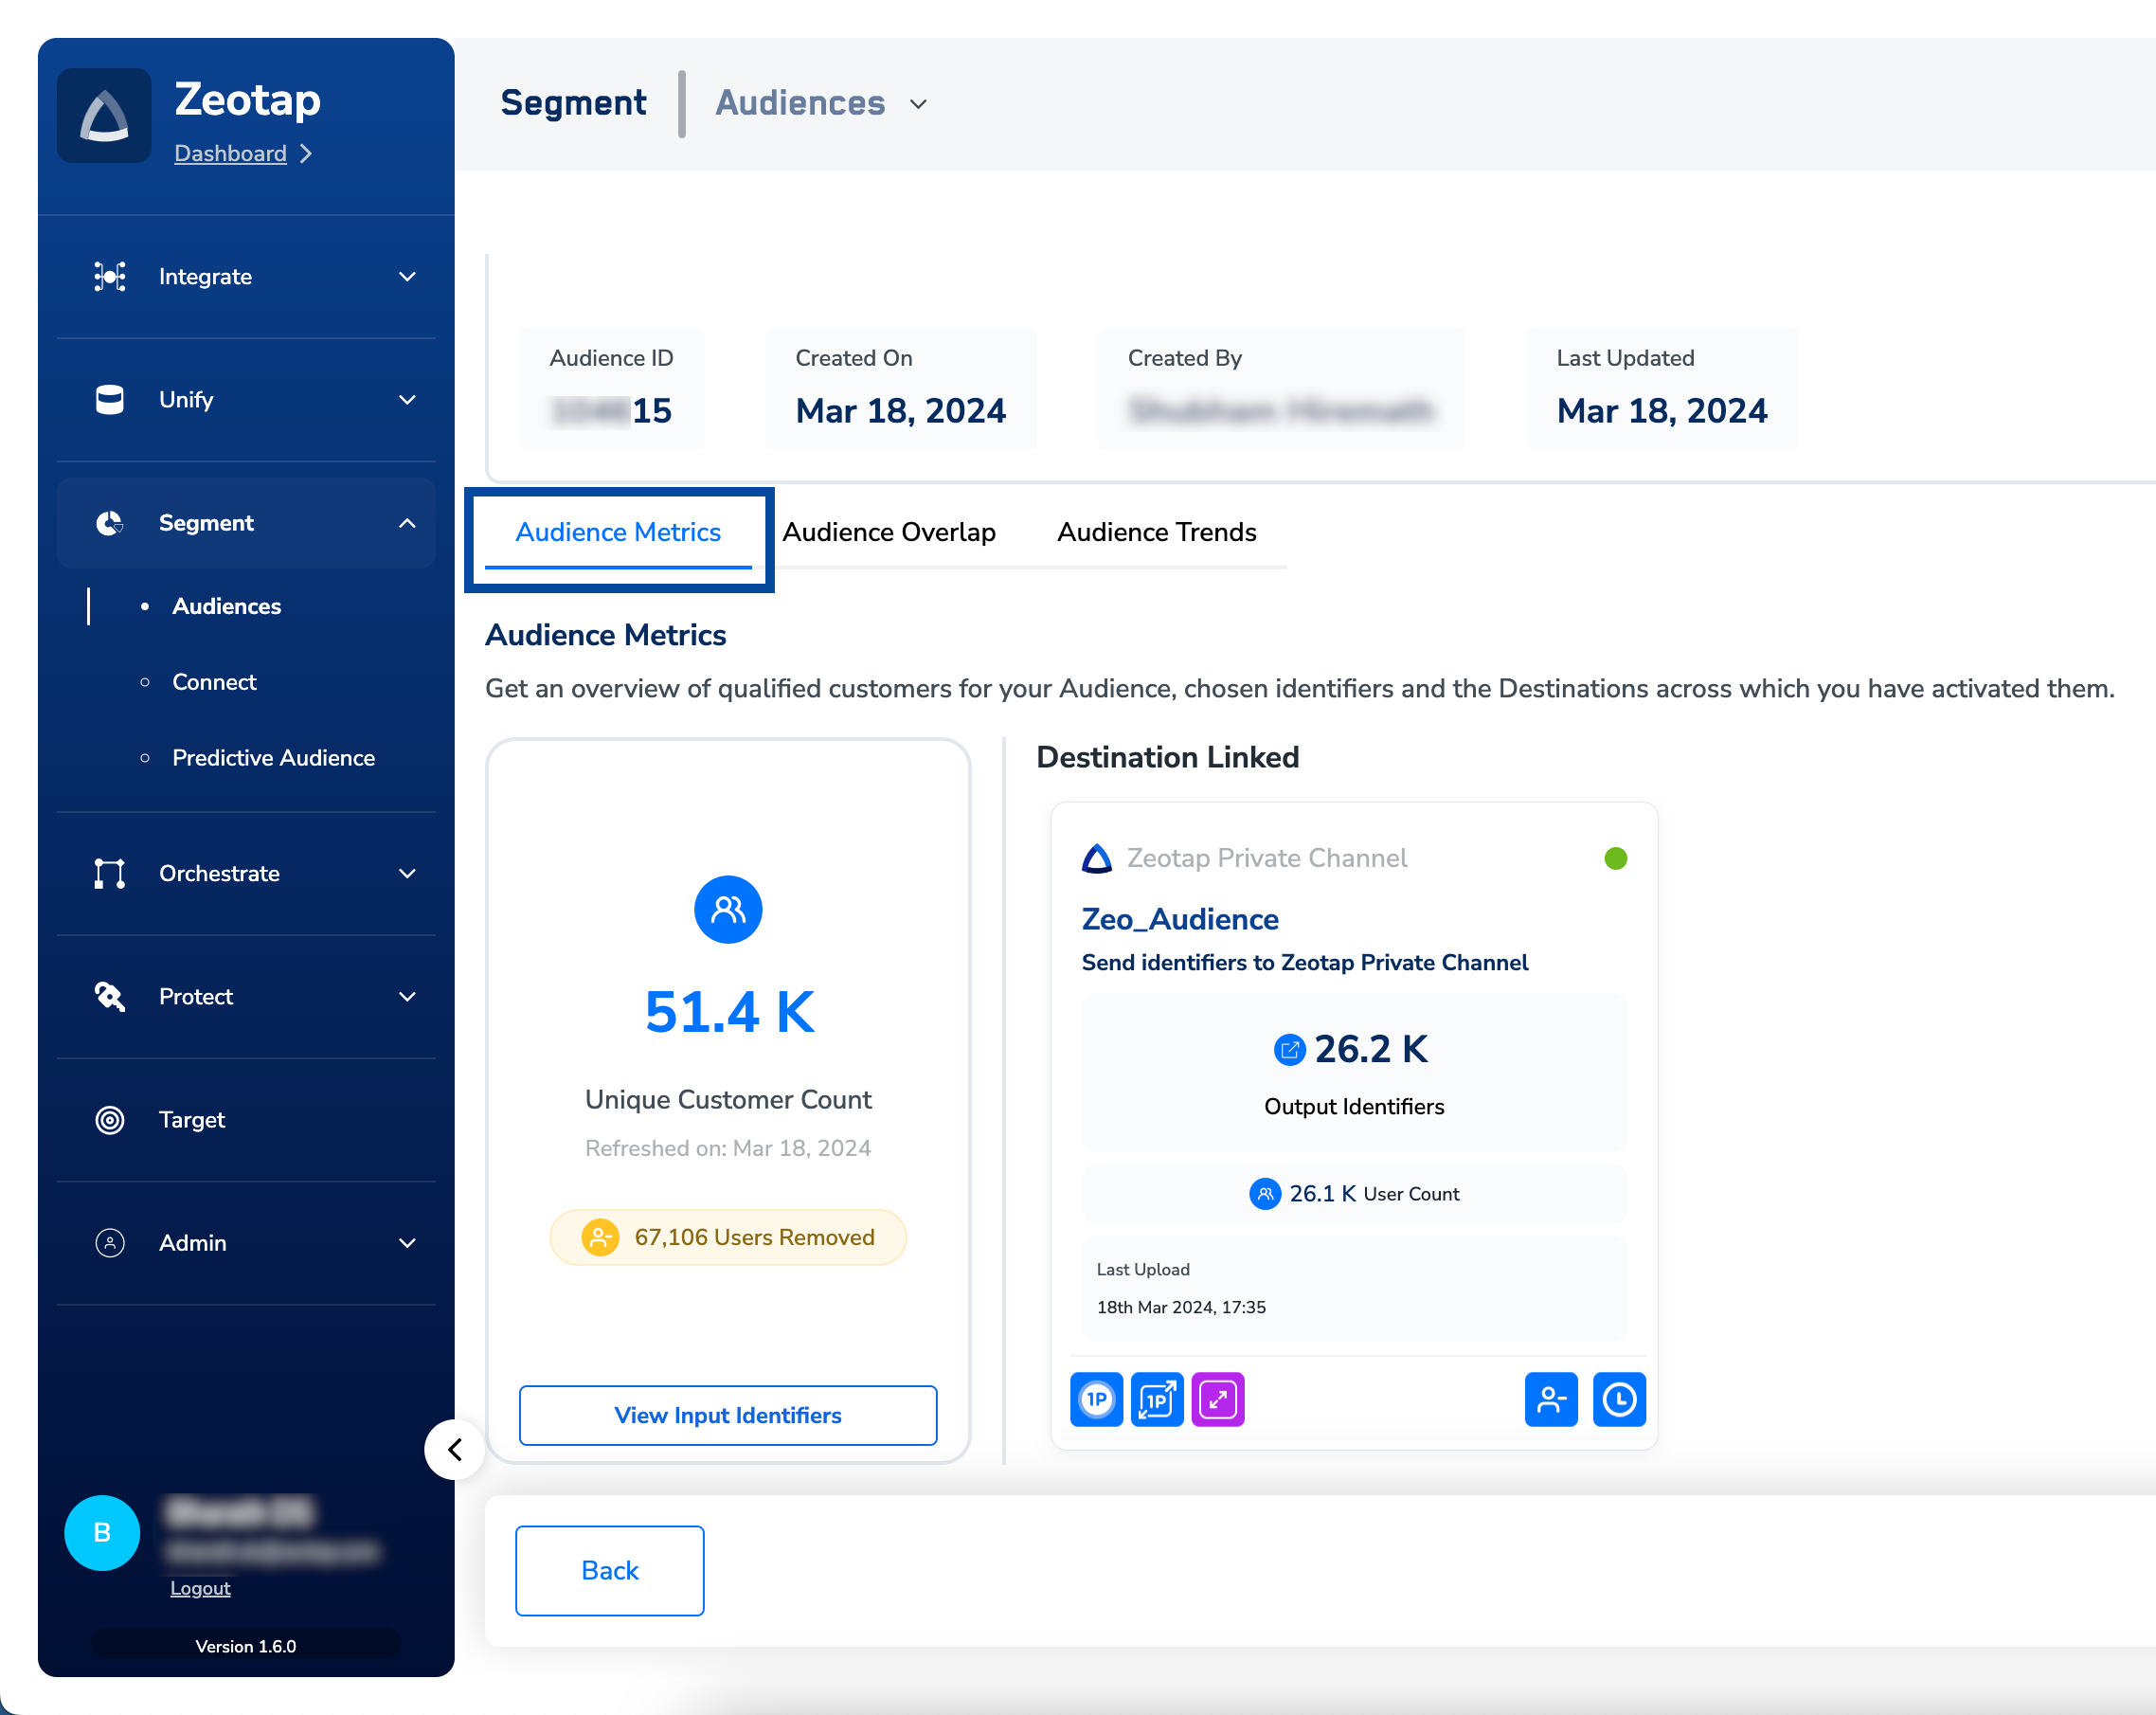
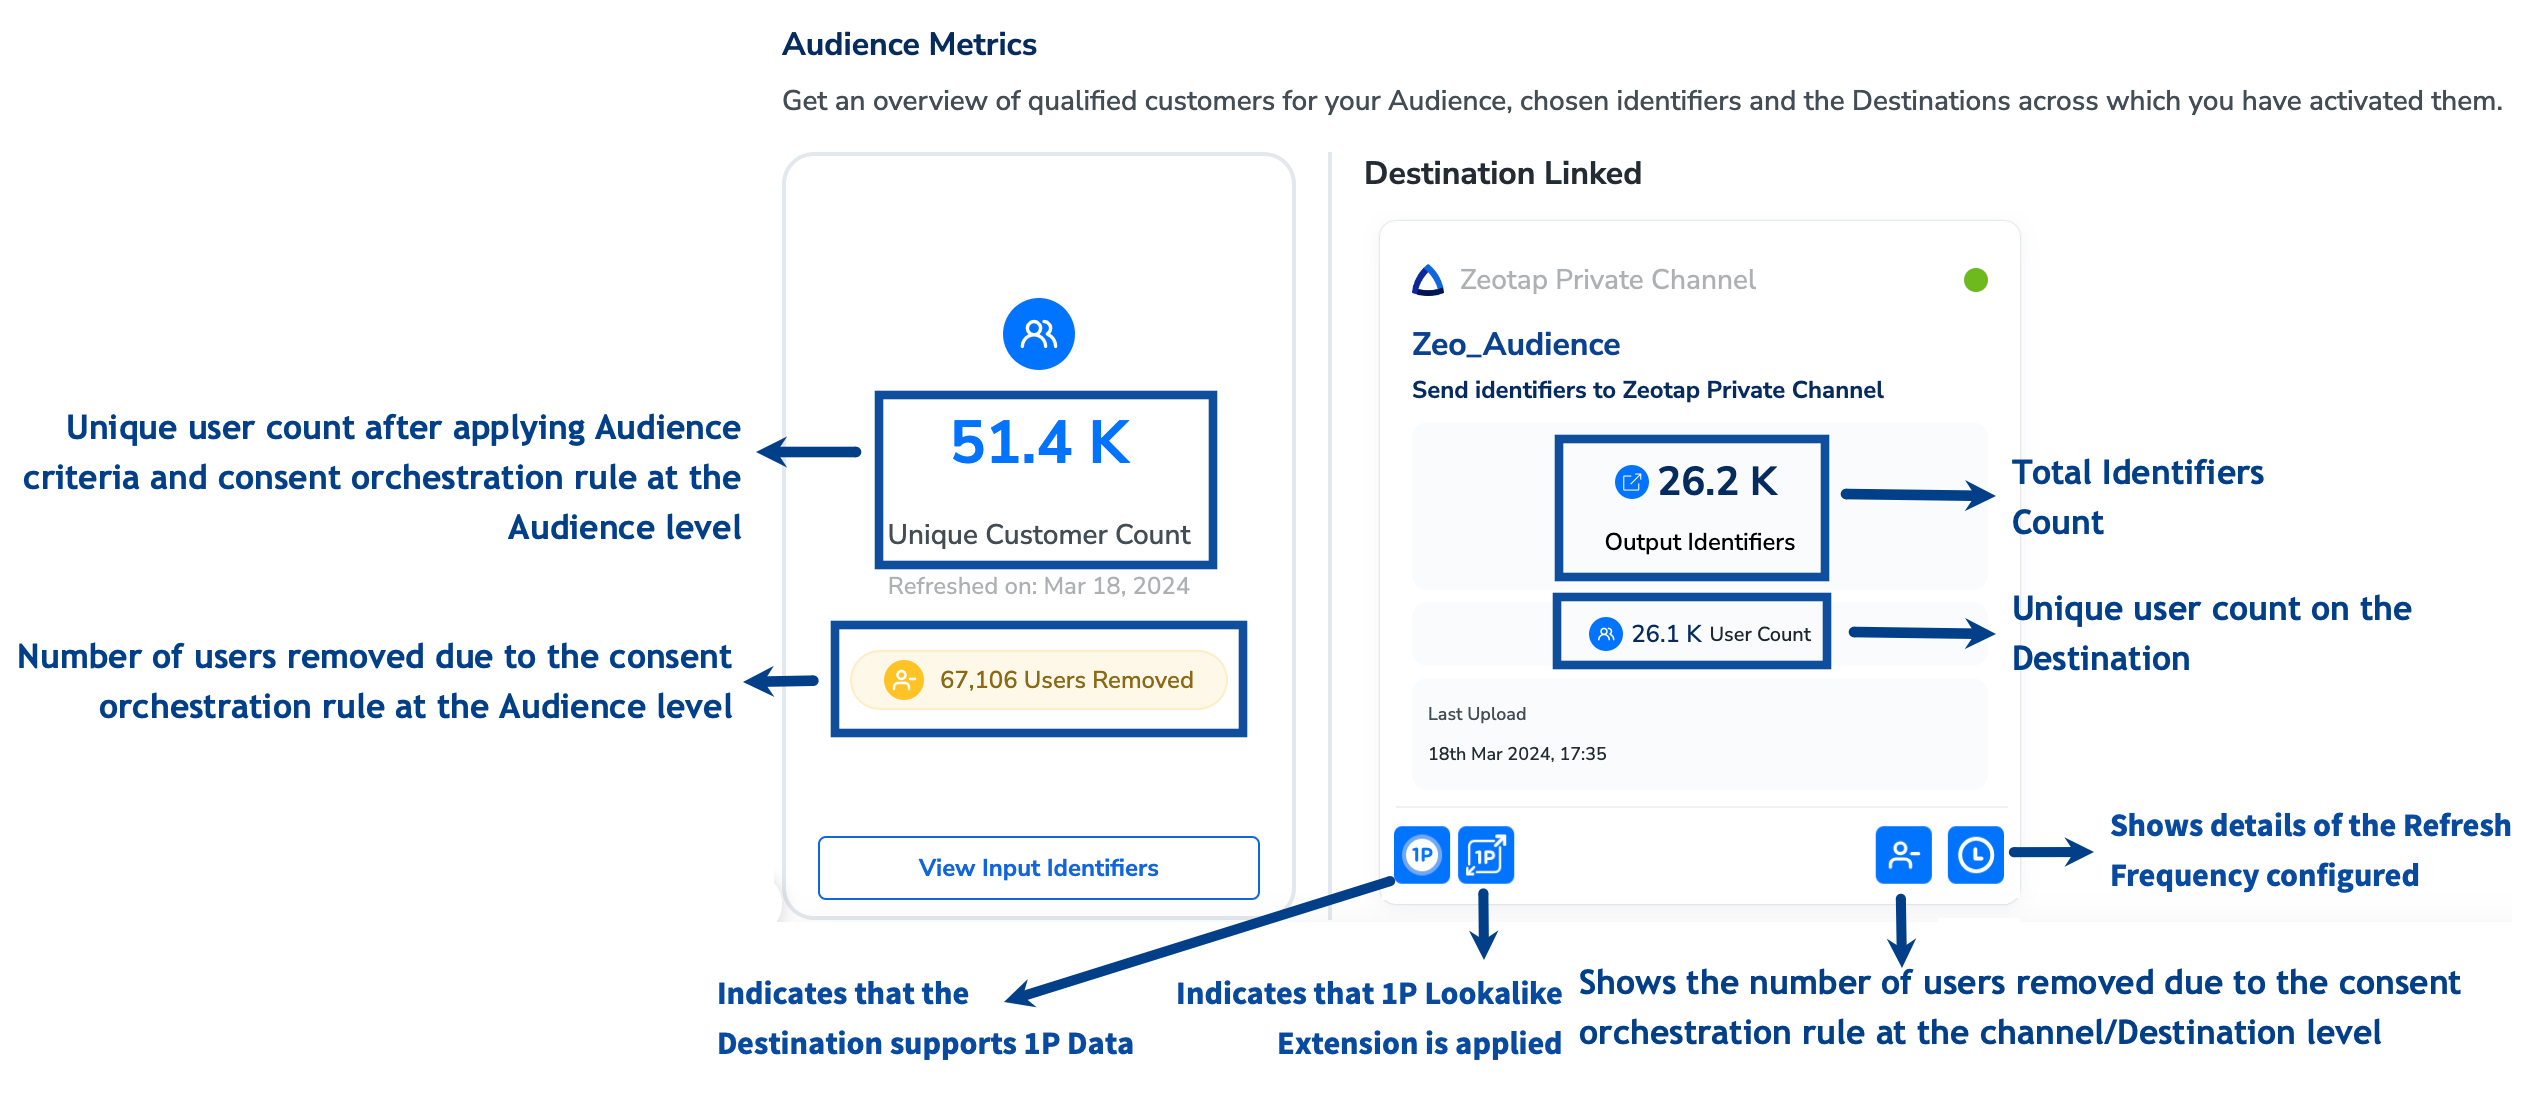
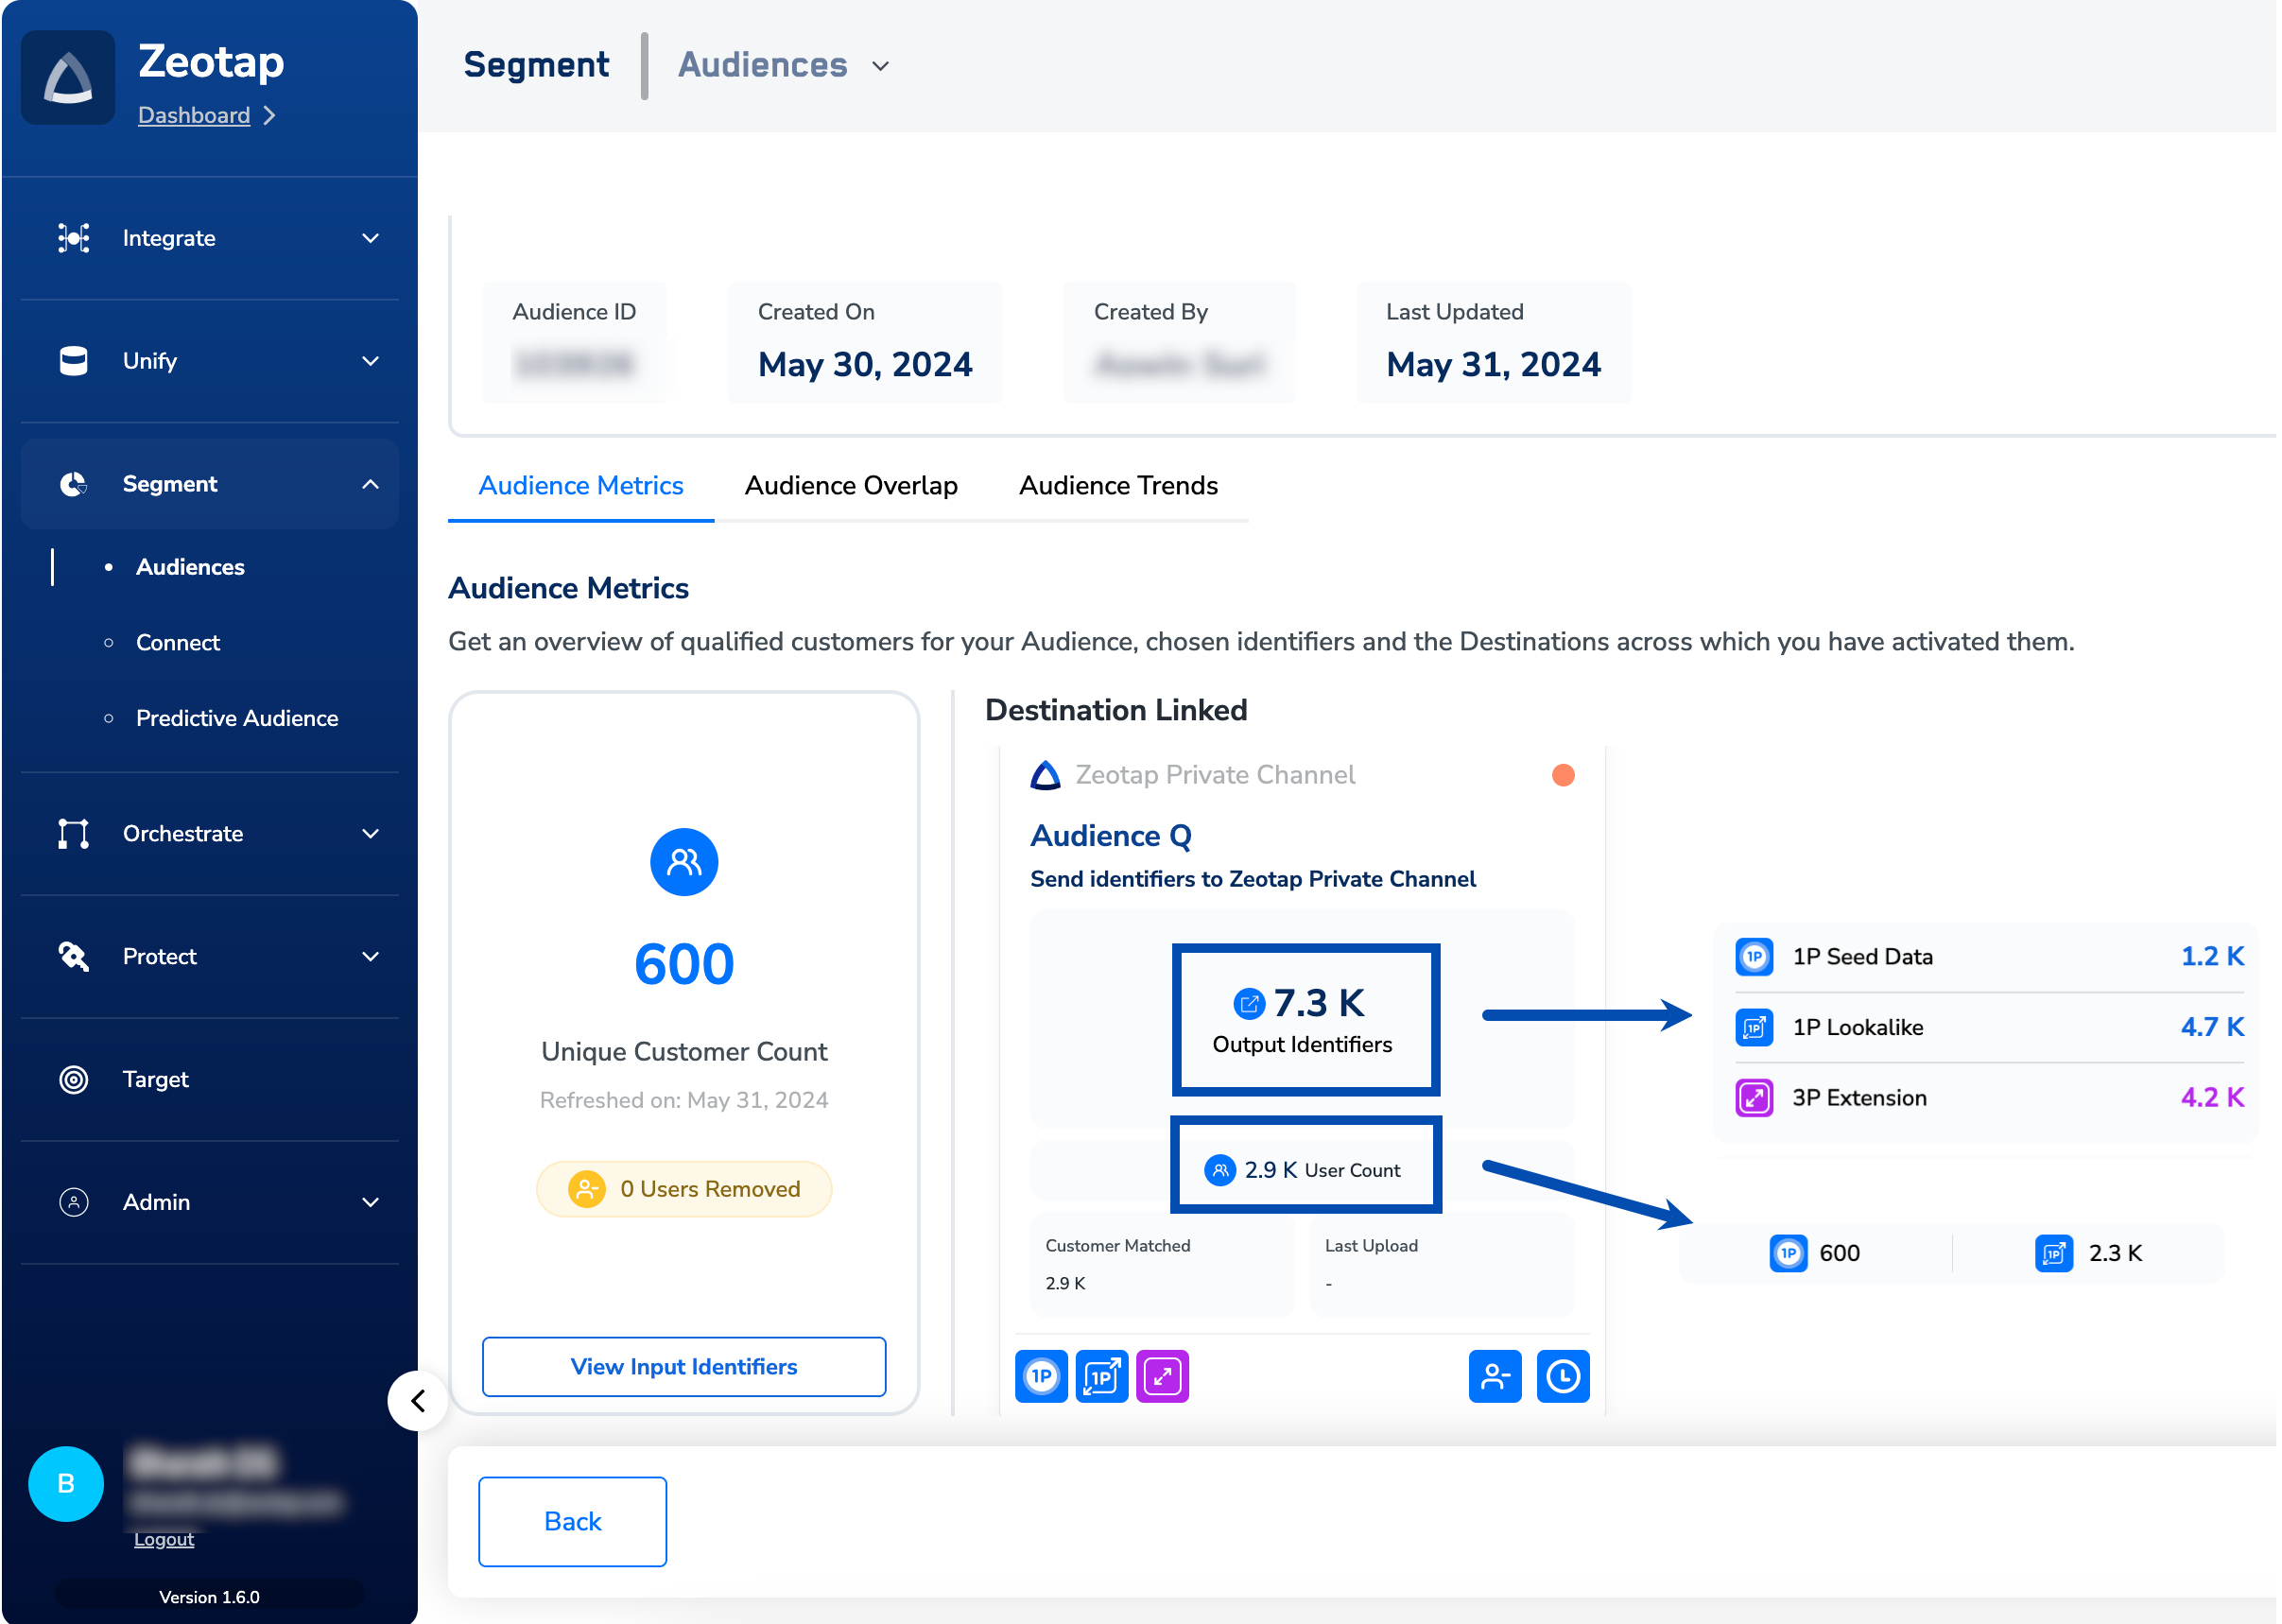
Note:The number under Output Identifiers represent the count of identifiers meeting the criteria you have set for your Audience after applying Consent Rule at Audience Level and Consent Rule at Channel Level.
Understand Audience Metrics with a Use Case
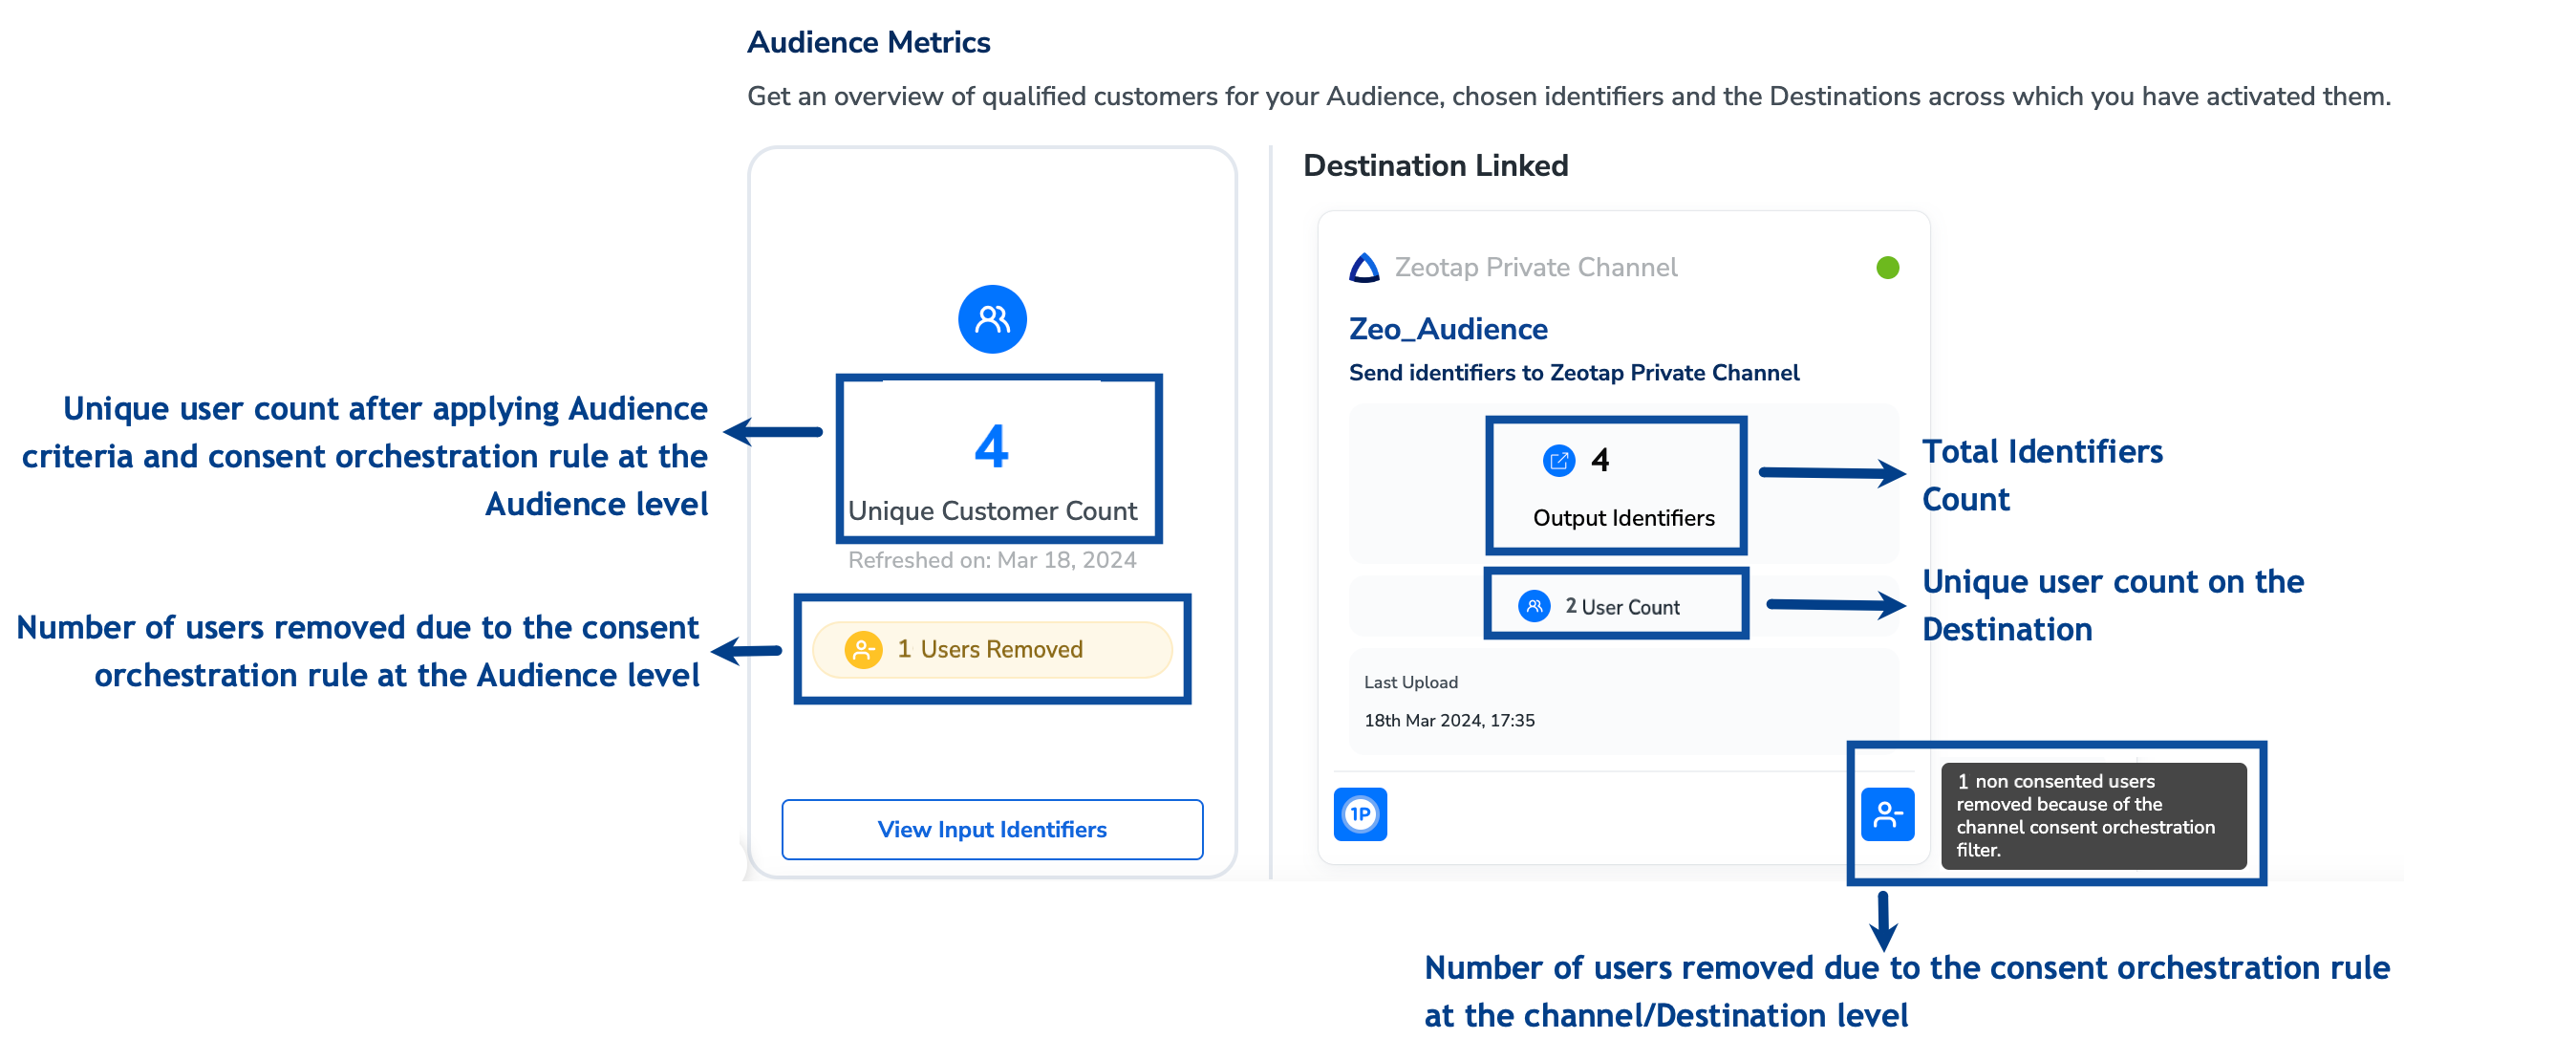
To understand how to interpret the various counts available on the Audience Metrics tab, let’s consider an example. Assuming all user profiles listed in the table below meet the Audience Criteria, we can determine the counts based on their compliance with the consent rules set at the Audience and channel levels, as well as the availability of output identifiers accepted by the Destination. The resulting counts are detailed in the Result section. Assumptions- All the below user profiles meet the Audience criteria.
- The chosen Destination accepts MAIDs and Phone numbers as output identifiers.
| Profiles | Email Address Available | Phone Number Available | MAIDs Available | Audience Consent Available | Channel Consent Available |
|---|---|---|---|---|---|
| UCID 1 | Yes | Yes | Yes | Yes | Yes |
| UCID 2 | Yes | Yes | No | No | Yes |
| UCID 3 | Yes | Yes | Yes | Yes | Yes |
| UCID 4 | No | No | Yes | Yes | No |
| UCID 5 | Yes | No | No | Yes | Yes |
| Audience Level Analysis | Destination Level Analysis |
|---|---|
Unique Customer Count: 4Reasoning:
| Output Identifier Count: 4
|
How to View Insights for an A/B Test enabled Audience?
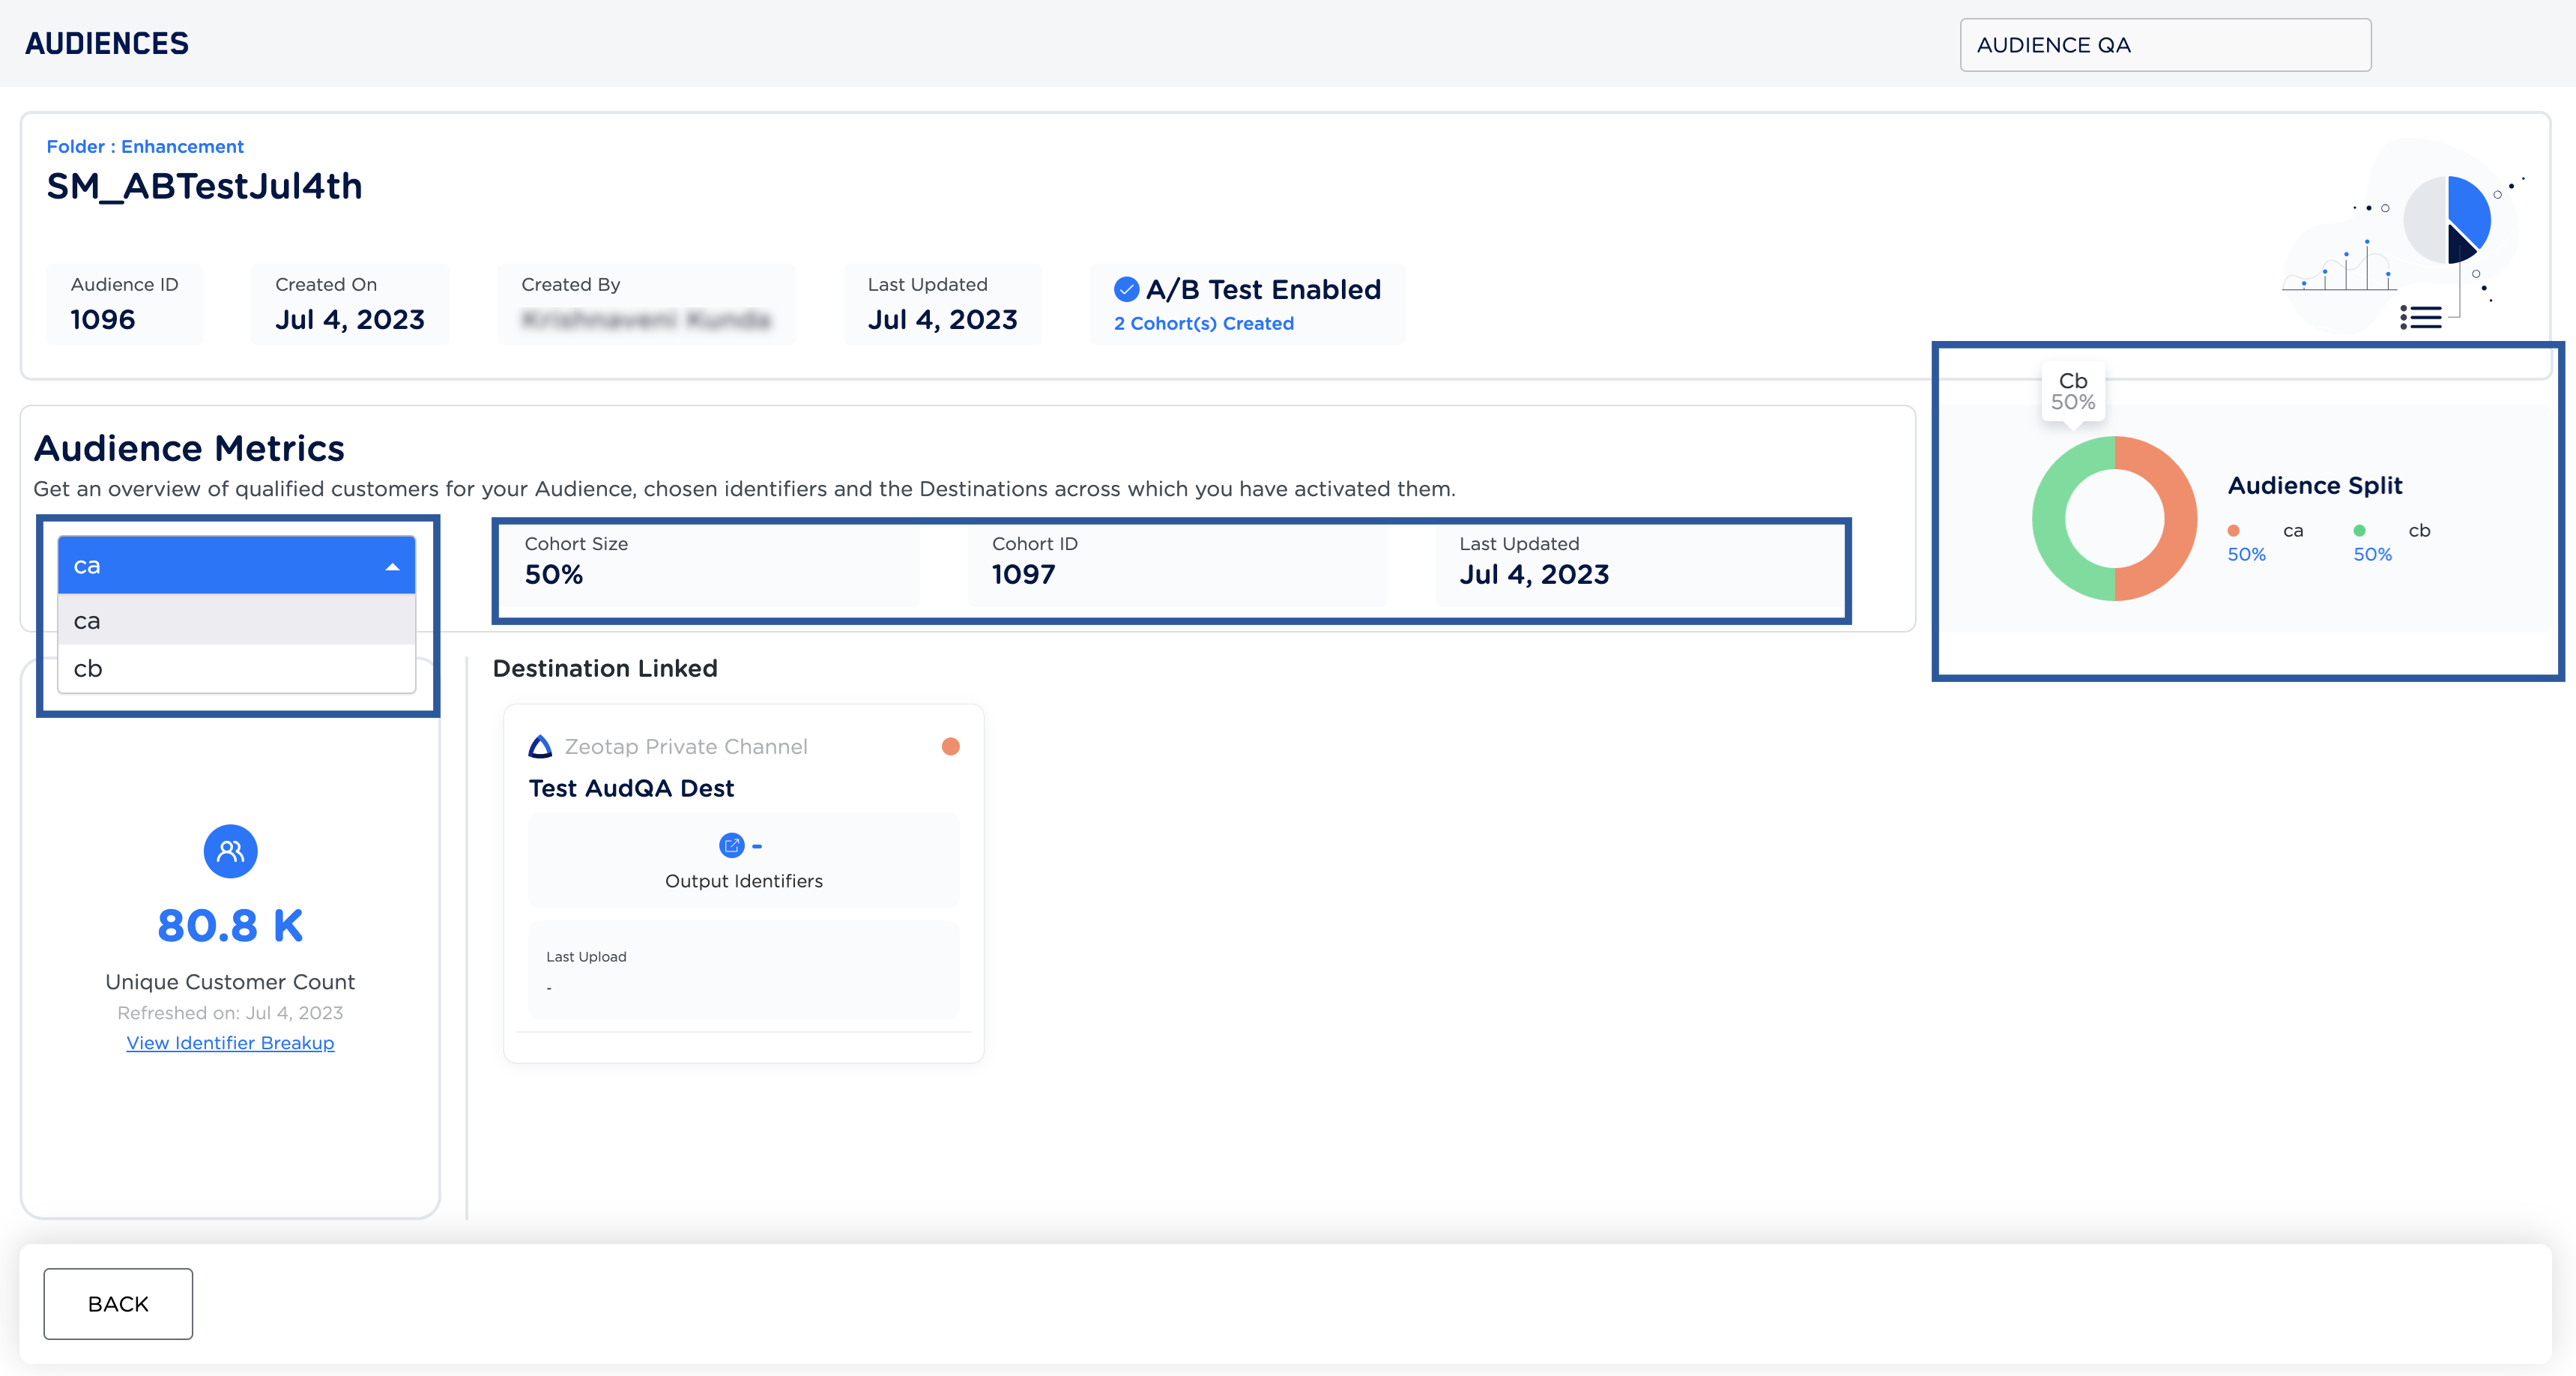
When you check the Audience Insights for an A/B Testing enabled Audience, you can choose the cohort for which you wish to view the metrics. Once chosen, the screen displays relevant information about the selected cohort, including theCohort Size, Cohort ID, and Last Updated date. By hovering over the Audience Split circle, you can also see the percentage share of each cohort. The process of viewing Audience metrics and the linked Destinations for each cohort is similar to the method mentioned above.
Audience Overlap
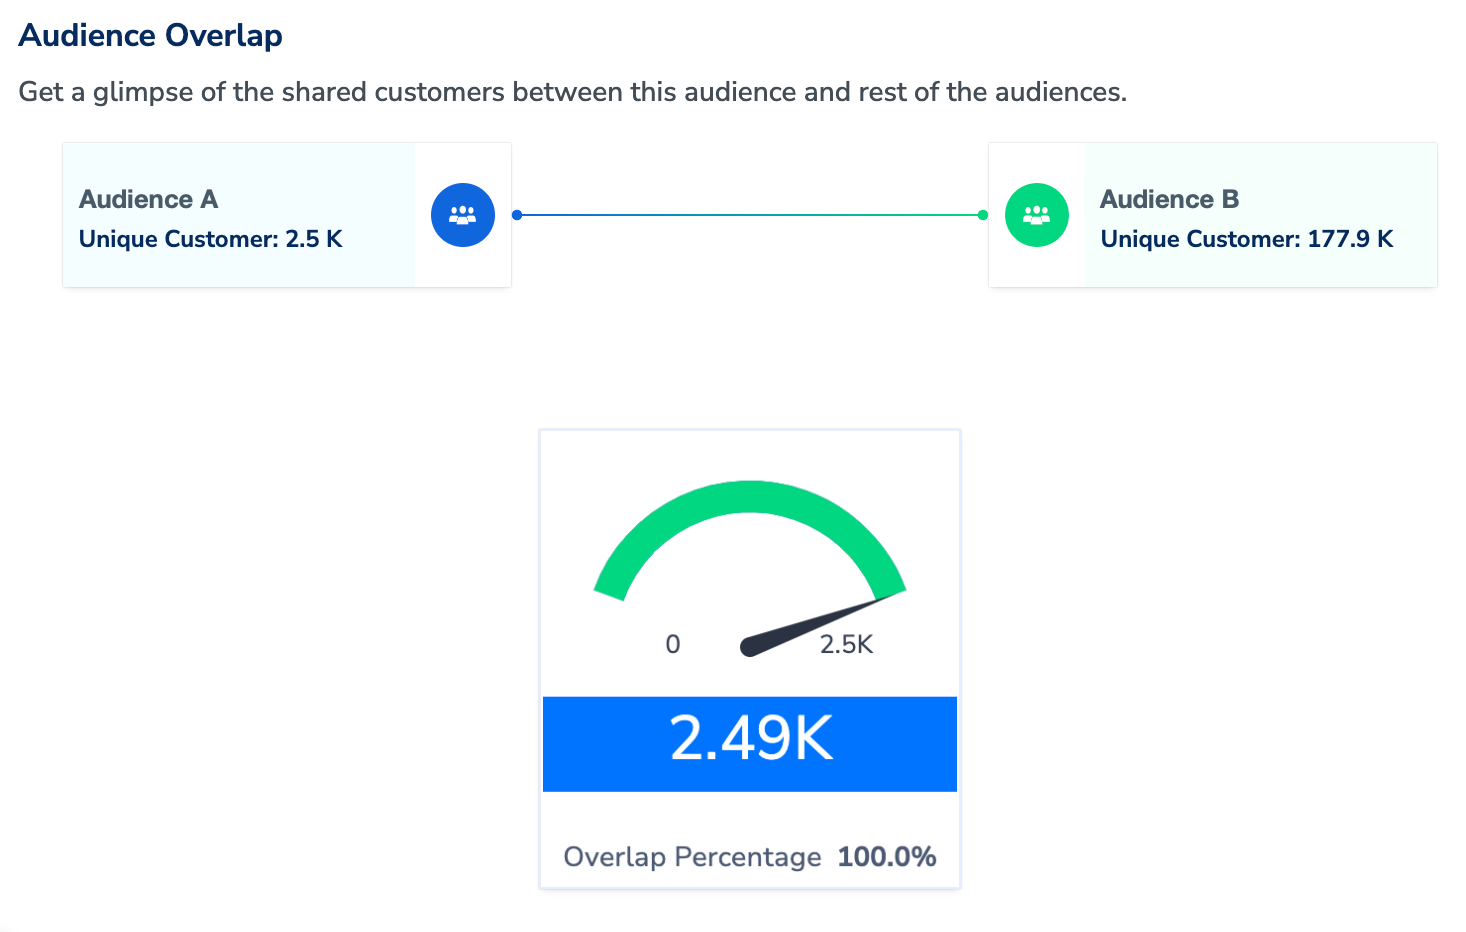
Audience Overlap denotes the shared customer percentage between two Audiences, providing valuable insights into customer behaviour for effective marketing strategies. It refreshes every three (3) hours. Let’s consider the following example showcasing the Audience Overlap feature: Consider two distinct Audiences mentioned below.- Audience A - Targets 2.5K unique Fitness Enthusiasts interested in gym memberships, workout apparel and fitness equipment.
- Audience B - Targets 177.9K unique Healthy Cooking Enthusiasts interested in organic food, recipe books and cooking utensils.
Note:The error in the overlap percentage is higher when the number of shared users is less than 1000 for the compared Audiences. Hence, exercise caution while using the Overlap functionality.
How to Use Audience Overlap?
In the Audience Overlap tab, you can view the unique customer counts of the two Audiences that your are comparing, along with the count of customers common to both. Note that one of the Audience has to be the one that you are working on, while you can choose the other Audience from the rest of the Audiences in Active and Published statuses, either by using the search box or by scrolling through the list. The overlap count and percentage may differ depending on the Audience you choose. You can download the complete overlap report of the selected audience with all existing audiences in the account by using the Download Report button shown in the image below. The report will be a CSV file showing the percentage overlap of the selected audience with all the other audiences in the account.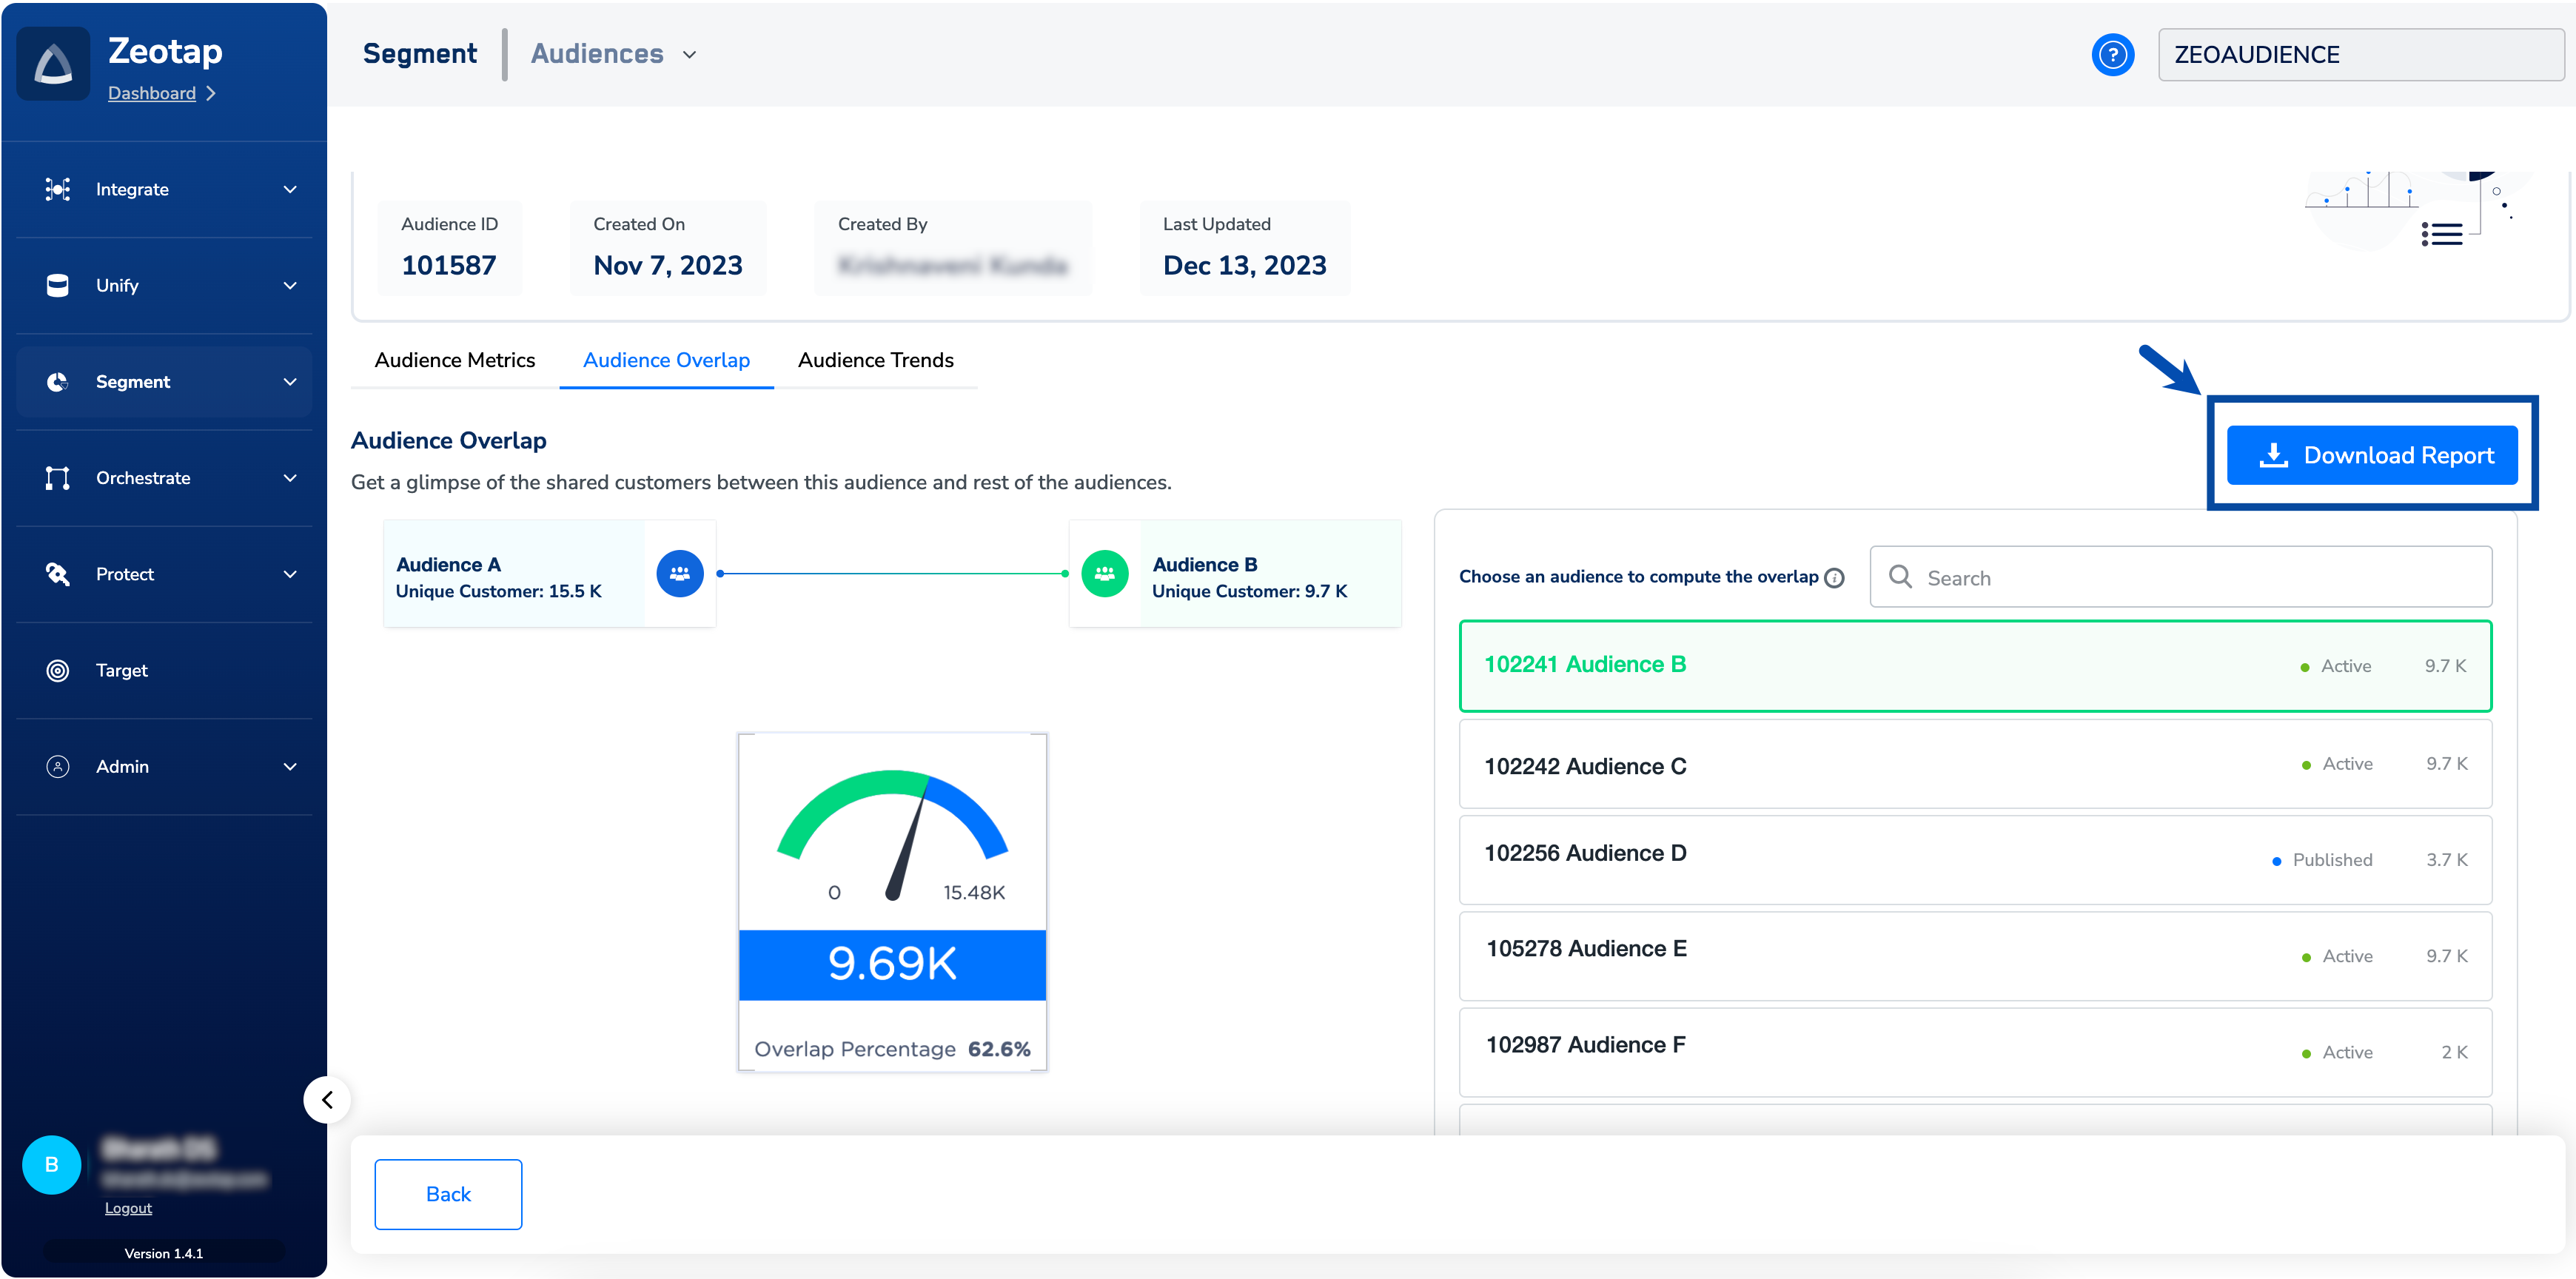
Audience Trends
In the Audience Trends tab, you can view real-time insights of your audience as per the configured refresh frequency. The count of qualified customers dynamically updates with the inflow of new data and qualifying criteria for the audience segment. Zeotap facilitates a retrospective analysis of your audience over the past 30, 60 or 90 days. The Audience Trends refreshes every three (3) hours.