Overview
What is the RFM Model? The RFM model is a powerful behavioral segmentation tool that groups users based on their past transactional and behavioral activity. It answers three fundamental questions about your customers:- Recency: How recently did they make a transaction/visit?
- Frequency: How often do they perform transaction/visit ?
- Monetary: How much do they spend?
- Understand Customer Behavior: Gain a deep understanding of your customer base at a glance.
- Personalize Marketing Campaigns: Tailor your messaging and offers to specific user groups.
- Prevent Customer Churn: Proactively identify and re-engage customers who are at risk.
- Increase Customer Lifetime Value: Nurture promising customers and turn them into loyal advocates.
How It Works
The model ingests event data and calculates R, F, and M scores for each user. It then uses a sophisticated machine learning process to group them into clusters.- Technology: The model is built on the K-means clustering algorithm. To enhance the accuracy of these clusters, it first applies Principal Component Analysis (PCA), a technique that reduces data complexity and noise. This ensures the resulting segments are as distinct and meaningful as possible.
- Output: The model’s output is a set of predefined clusters. Each user is assigned to one of these clusters, and this cluster label is made available as a smart attribute that can be used directly in the Audience module.
Configuring the RFM Model: A Step-by-Step Guide
Setting up an RFM model is a simple, three-step process.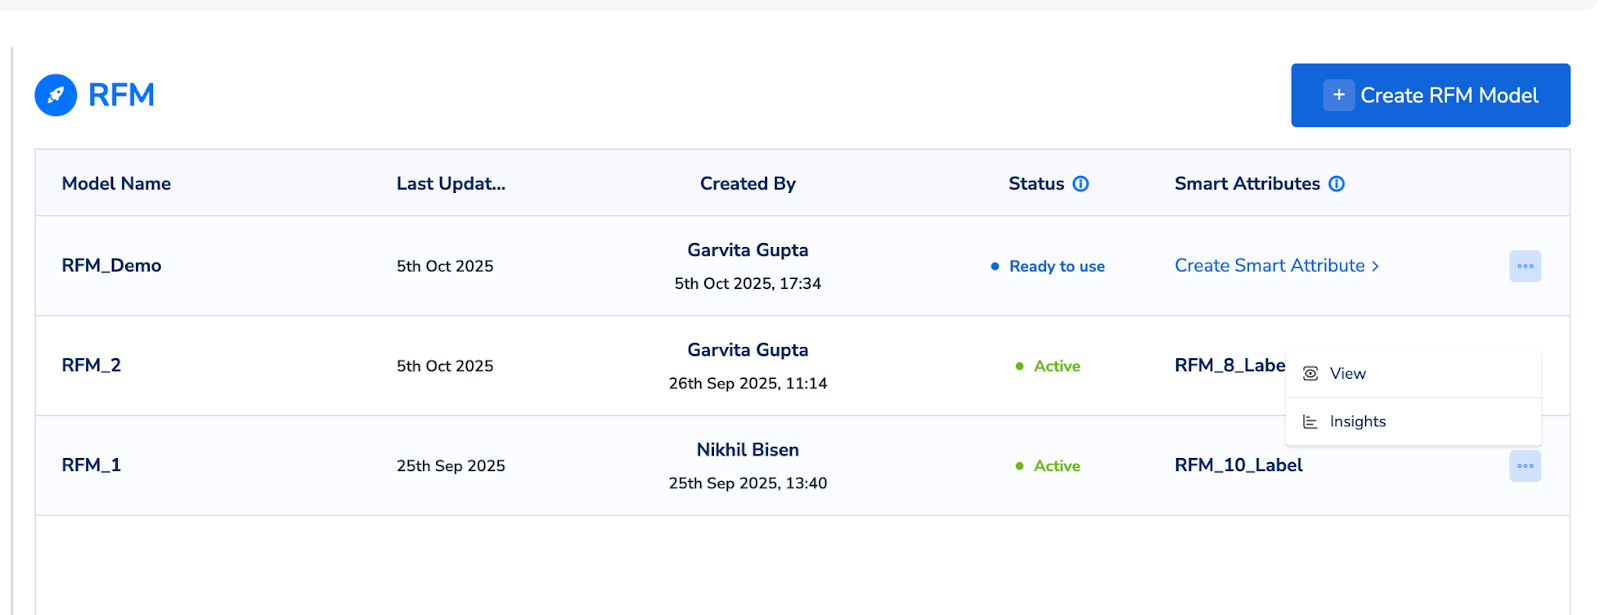
Step 1:
Basic Details Navigate to Segment > Predictive Models and click on “Create New Model.”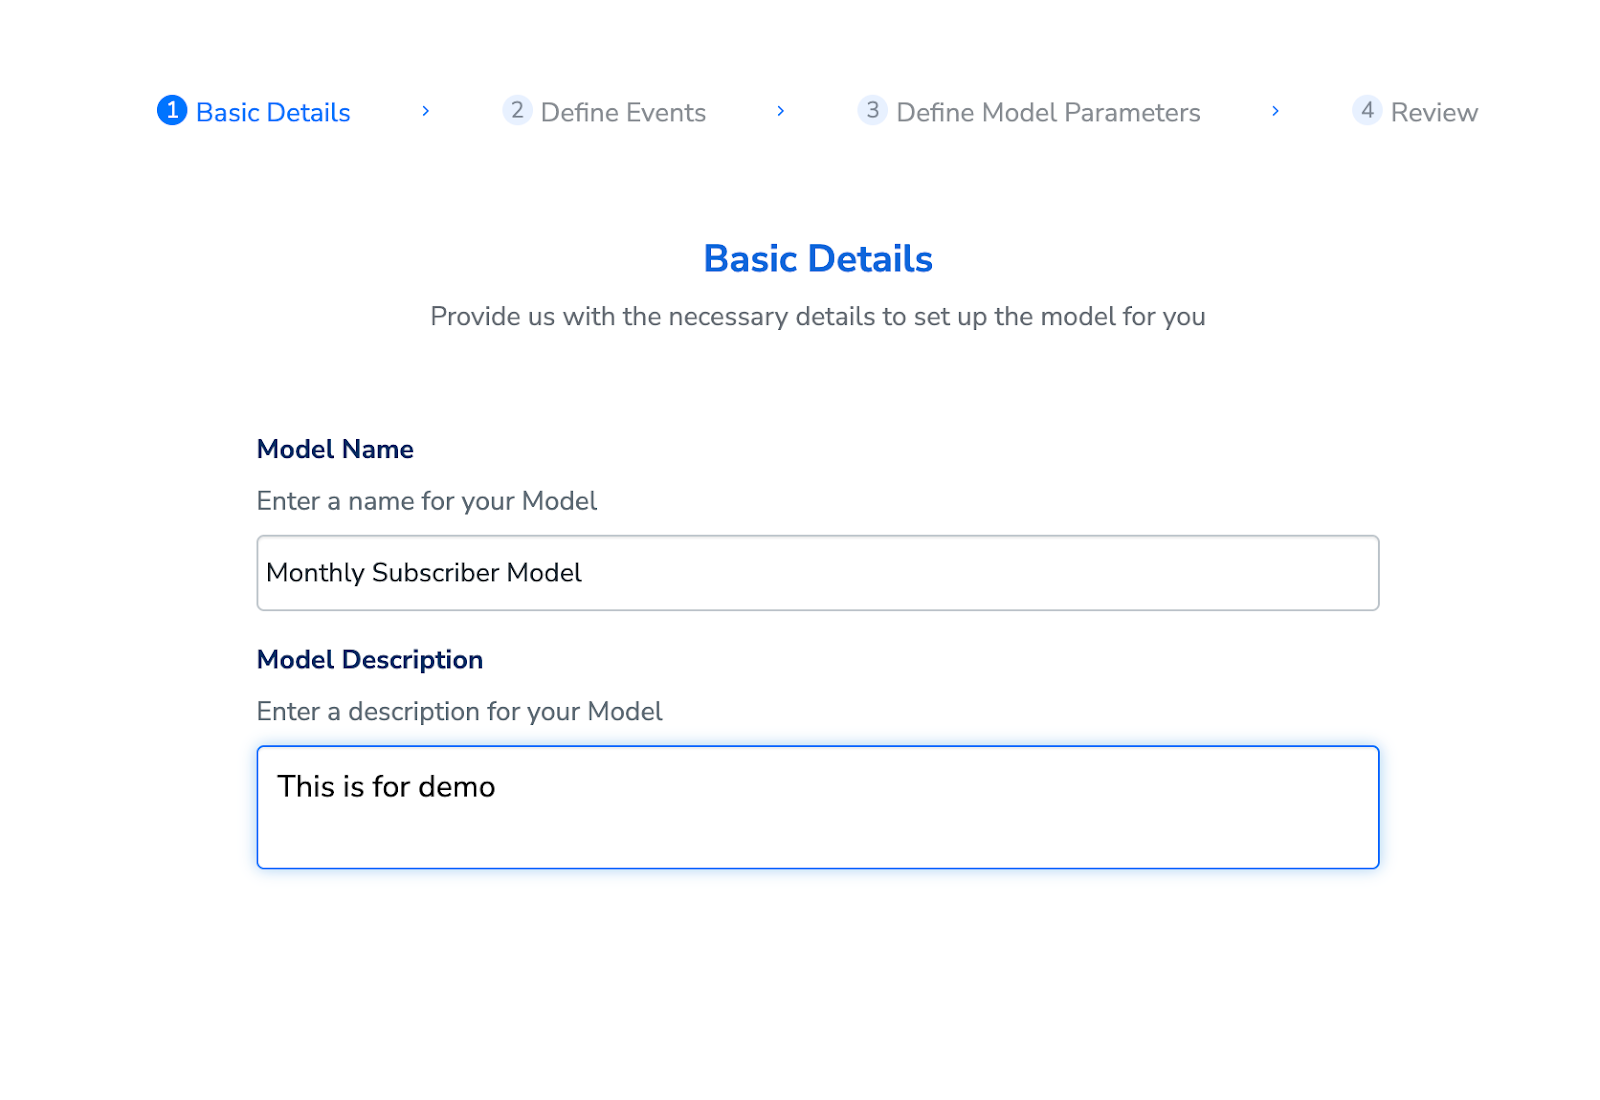
- Model Name: Give your model a descriptive name (ex - “Monthly Subscriber Model”).
- Description: Add a brief description for context.
Step 2:
Define the Core Event This is where you tell the model what user action you want to analyze.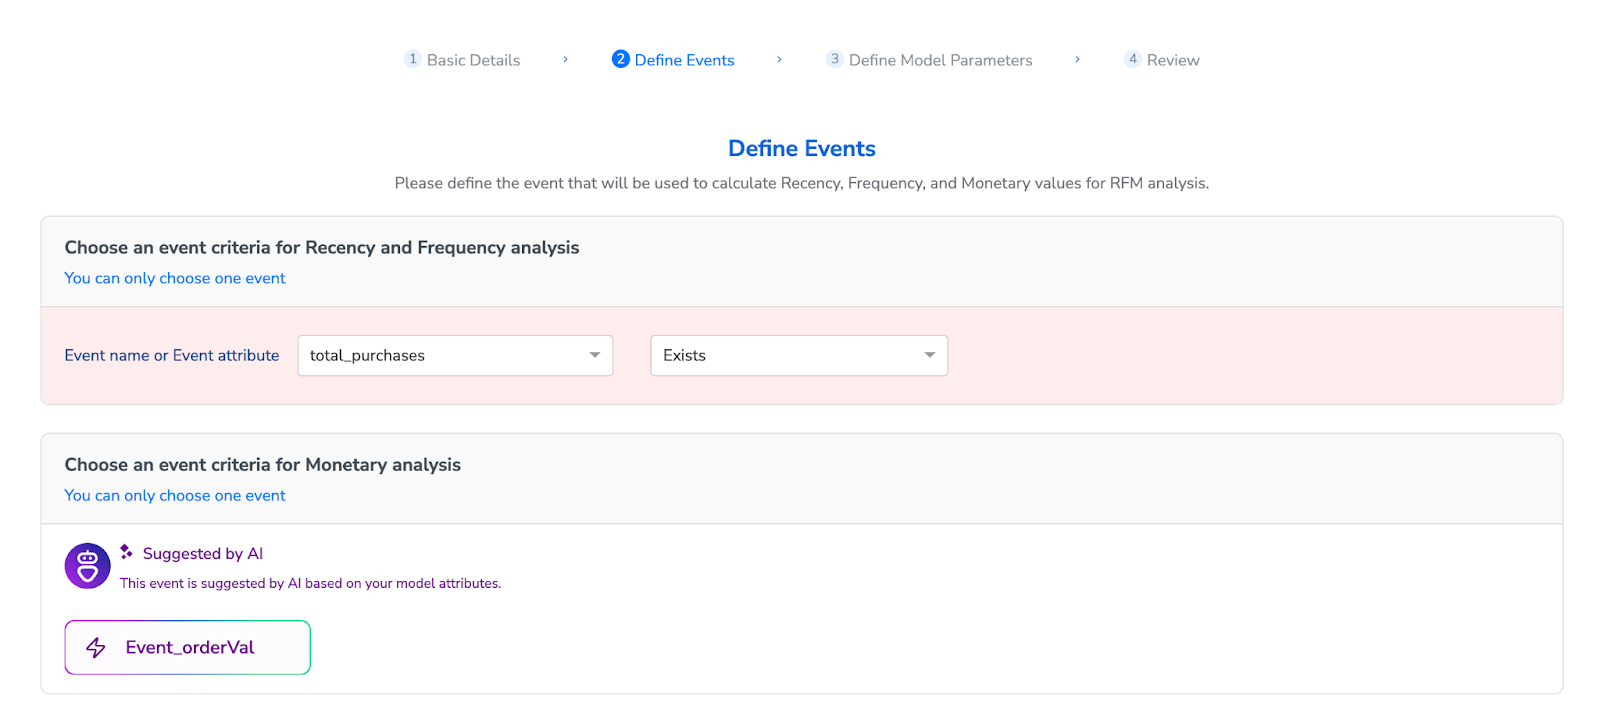
- Event for Recency and Frequency: Choose the event that represents the key transaction for your business. For a retail business, this could be a ‘purchase’ event. For a telecom provider, it could be a ‘recharge’ or ‘plan_renewal’ event.
- Attribute for Monetary Value: Our AI module will automatically suggest the most relevant attribute for monetary (ex- , Ordervalue, recharge_amount).
Step 3:
Define Model Parameters In the final step, you’ll set the operational parameters for the model.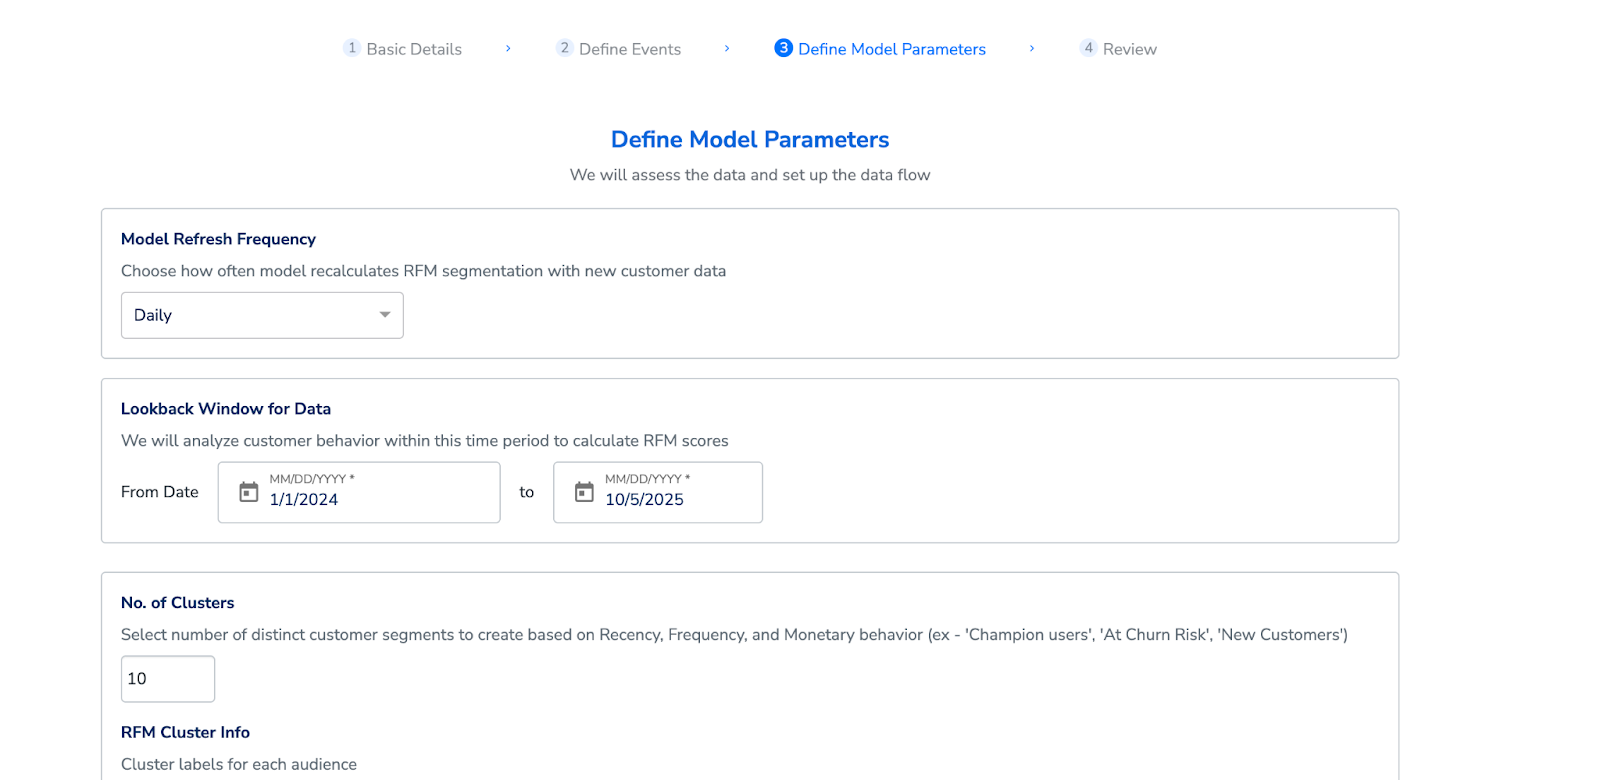
- Model Refresh Frequency: Choose how often you want the model to run and re-calculate the clusters (ex - Daily, Weekly, Monthly).
- Lookback Window for Data: Define the time period of historical data the model should analyze to train the RFM model.
- Number of Clusters: You can choose between 5 and 10 clusters. The model comes with 10 predefined, named clusters for maximum granularity.
Understanding the Insights Dashboard
After the model has run, it will generate an interactive dashboard that provides a comprehensive overview of your customer segments. You will see:- Cluster Distribution: A visual breakdown of how many users fall into each of the 10 clusters.
- Cluster Averages: For each cluster, you can view the average Recency (in days), average Frequency of transactions, and average Monetary value.
The 10 RFM Clusters Explained
The model groups users into 10 intuitive clusters, each representing a different behavioral pattern as listed below -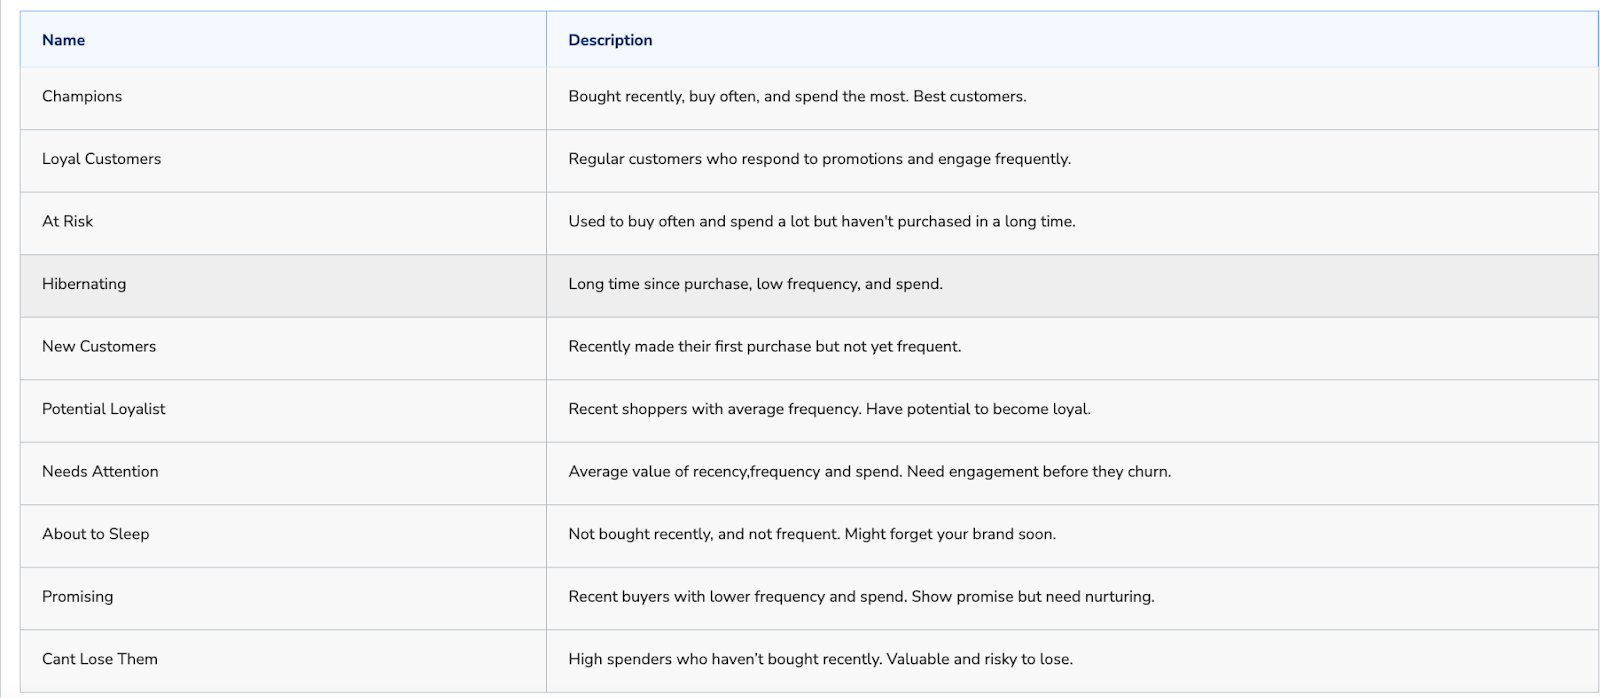
Activating Your RFM Segments
The real power of the RFM model lies in activation. Once the model runs, the cluster label for each user is saved as a smart attribute. You can then navigate to the Audiences module and use this smart attribute to build segments for your marketing campaigns, journeys, and analytics.Use Cases and Examples
For Retail:- Nurture Potential Loyalists: Create a segment of “Potential Loyalist” customers and launch upselling campaigns, upgraded to loyalty membership tier or early access to sales to convert them to ‘Champion’ users.
- Re-engage “At Risk” Customers: Target the “At Risk” segment and launch win-back campaign by offering discounts.
- Reward Champions: Create an exclusive rewards program for your “Champions” cluster, offering them priority customer service, or discounts on new services.
- Prevent Churn: Build an audience of users in the “About to Sleep” cluster and proactively send them a personalized offer for a data top-up or a plan upgrade to keep them engaged.
How do I choose the right 'event' for my RFM model? What if I have multiple important events (e.g., 'add to cart' and 'purchase')?
How do I choose the right 'event' for my RFM model? What if I have multiple important events (e.g., 'add to cart' and 'purchase')?
Always choose the event that represents the most significant value exchange with your customers. For most businesses, this is the purchase confirmation event. While events like ‘add to cart’ are important behavioral indicators, the RFM model is designed to analyze realized value. If you want to analyze pre-purchase engagement, you might consider choosing separate behavioral events for RFM segmentation.
What is the ideal 'lookback window' for my data? How far back should I go?
What is the ideal 'lookback window' for my data? How far back should I go?
The lookback window is used to train the RFM model and hence it should be large enough to reflect your typical customer purchase cycle and capture any seasonality trends. We typically recommend to include training data of atleast 1 year
Should I choose 5 or 10 clusters? What's the practical difference?
Should I choose 5 or 10 clusters? What's the practical difference?
Start with 10 clusters. This provides the most granular view of your customer base and allows for highly targeted campaigns. The 10 predefined clusters cover a wide spectrum of behaviors, from your absolute best customers (“Champions”) to your most inactive (“Hibernating”). If you find that some clusters are too small to be actionable for your business, you can consider re-running the model with 5 clusters for a broader segmentation.
What are the minimum data requirements for the RFM model to be effective? What if a customer has very little data?
What are the minimum data requirements for the RFM model to be effective? What if a customer has very little data?
For the model to generate meaningful clusters, a customer should ideally have:
- At least a few thousand users with transactional data.
- A sufficient number of transaction events within the chosen lookback window (at least 10,000+ events is a good starting point).
- Data that is not excessively sparse (i.e., most users have made more than one purchase). If a customer has very new or limited data, the clusters may be heavily skewed towards ‘New Customers’. In such cases, advise them to wait until they have accumulated more data before running the model for the first time.
What is the best way for a customer to measure the ROI of using the RFM model?
What is the best way for a customer to measure the ROI of using the RFM model?
Encourage them to conduct A/B tests. For example, they can create a campaign targeting their ‘At Risk’ cluster.
- Group A (Control): Receives no special offer.
- Group B (Test): Receives a personalized “we miss you” discount. By measuring the conversion rate and revenue generated from Group B compared to Group A, they can directly attribute the uplift to the RFM-based segmentation.