Panel 1 – Data Ingestion Details
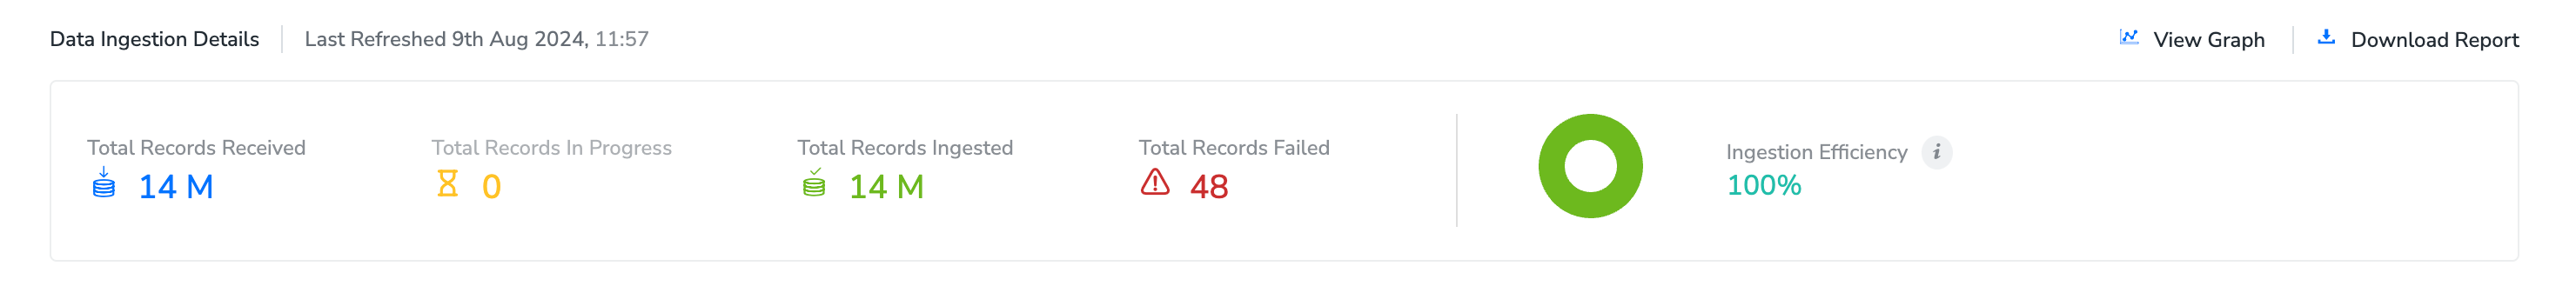
- Total Record Received – The total records received minus the total in-progress records.
- Total Record In Progress – The count of records that are being ingested.
- Total Record Ingested – The count of records that are ingested and available for activation.
- Total Records Failed – The count of records that failed to ingest during ingestion.
- Pie Chart – A visual representation of the record received v/s in progress, v/s failed v/s ingested.
- Ingestion Efficiency – This is calculated as the Total record ingested/Record received (for the ingested records). If the status is Failed, then the ingestion frequency is denoted as NA.
-
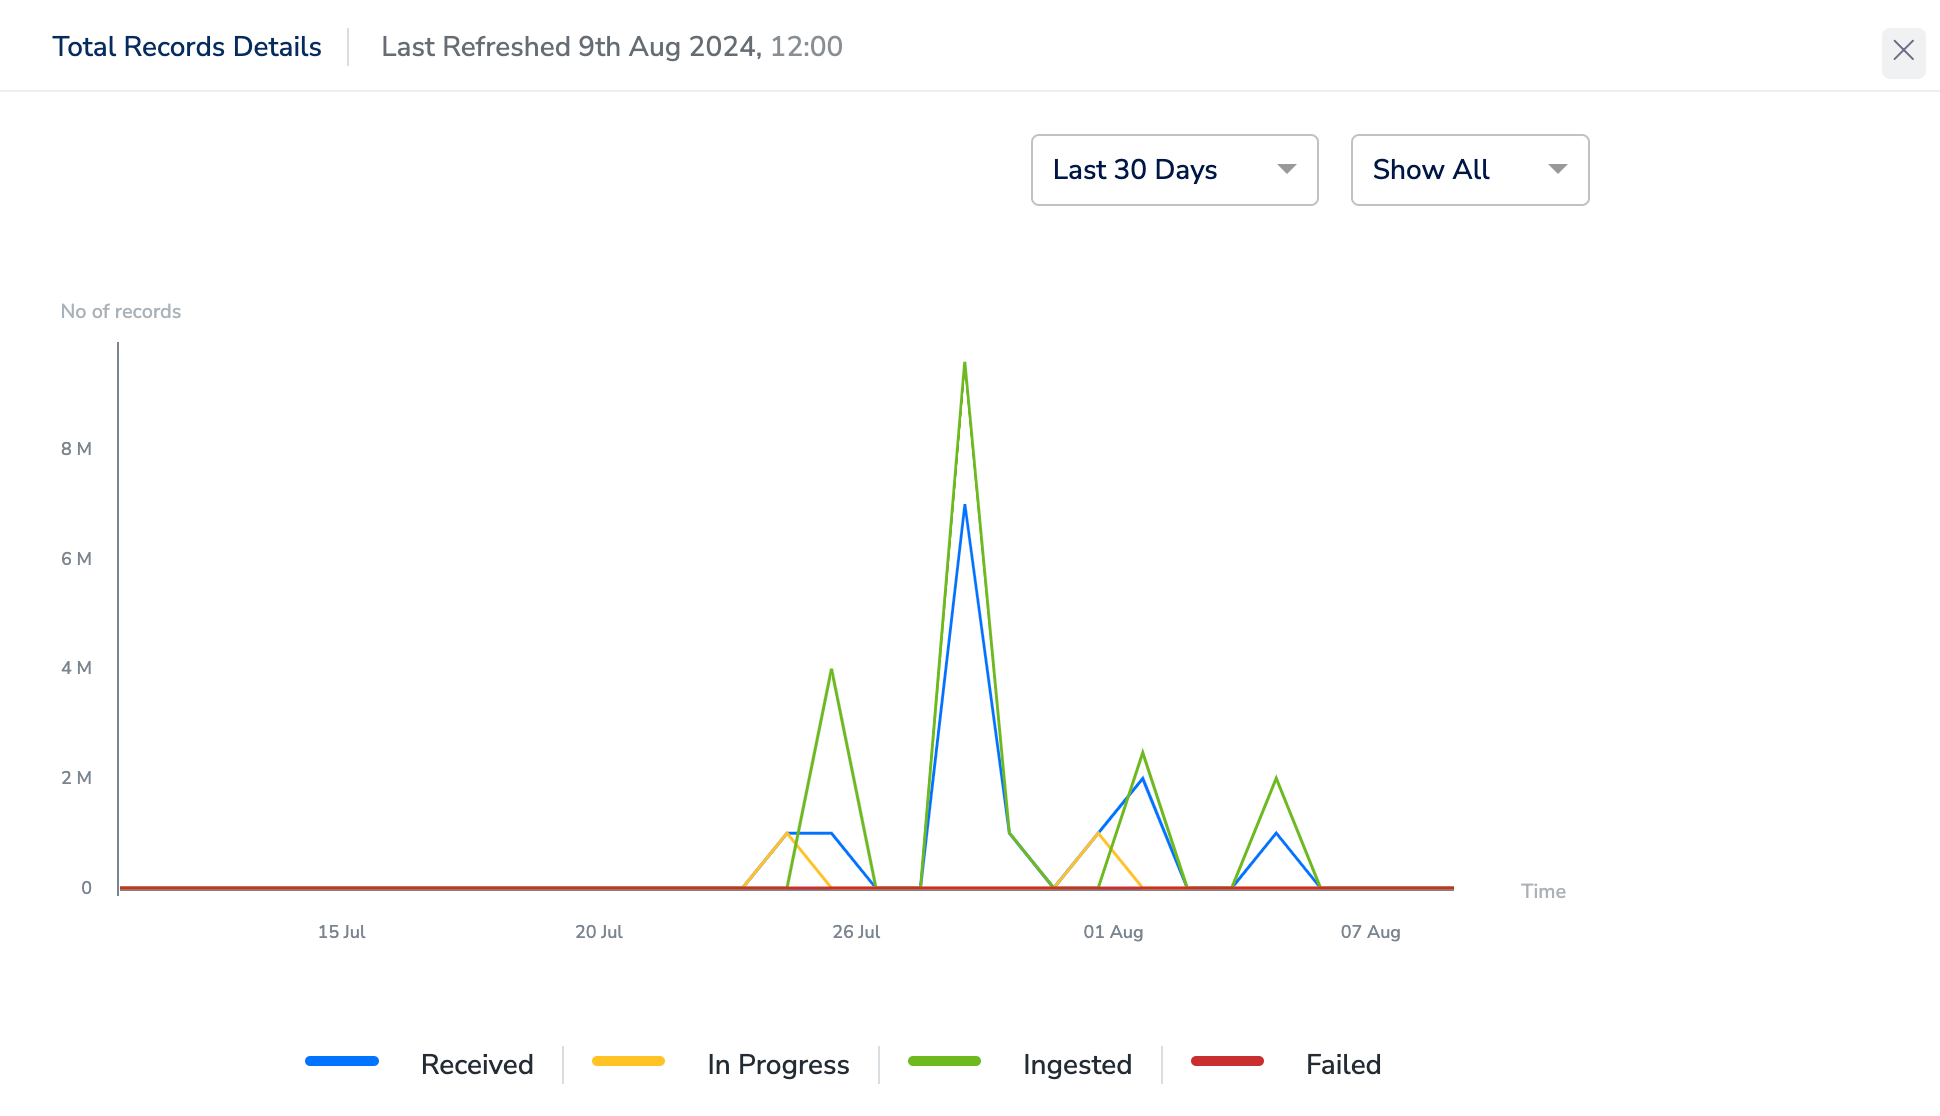
View Graph – This graph is only visible for streaming sources where Zeotap fetches or collects data. This displays the trend graph of the data received and processed for this source by its status. You can view the graph for periods ranging from the last 7 to 90 days or set a custom date range. It also allows you to filter by status.
Once a source is mapped, ingestion may take up to 15 minutes to begin. This delay accounts for processing the data collected between the time the source was integrated and when it was mapped. After the initial ingestion starts, all subsequent records will be ingested in real time as they arrive.
- Download Report – Clicking the Download Report option downloads an image snapshot of the source report in .png format.
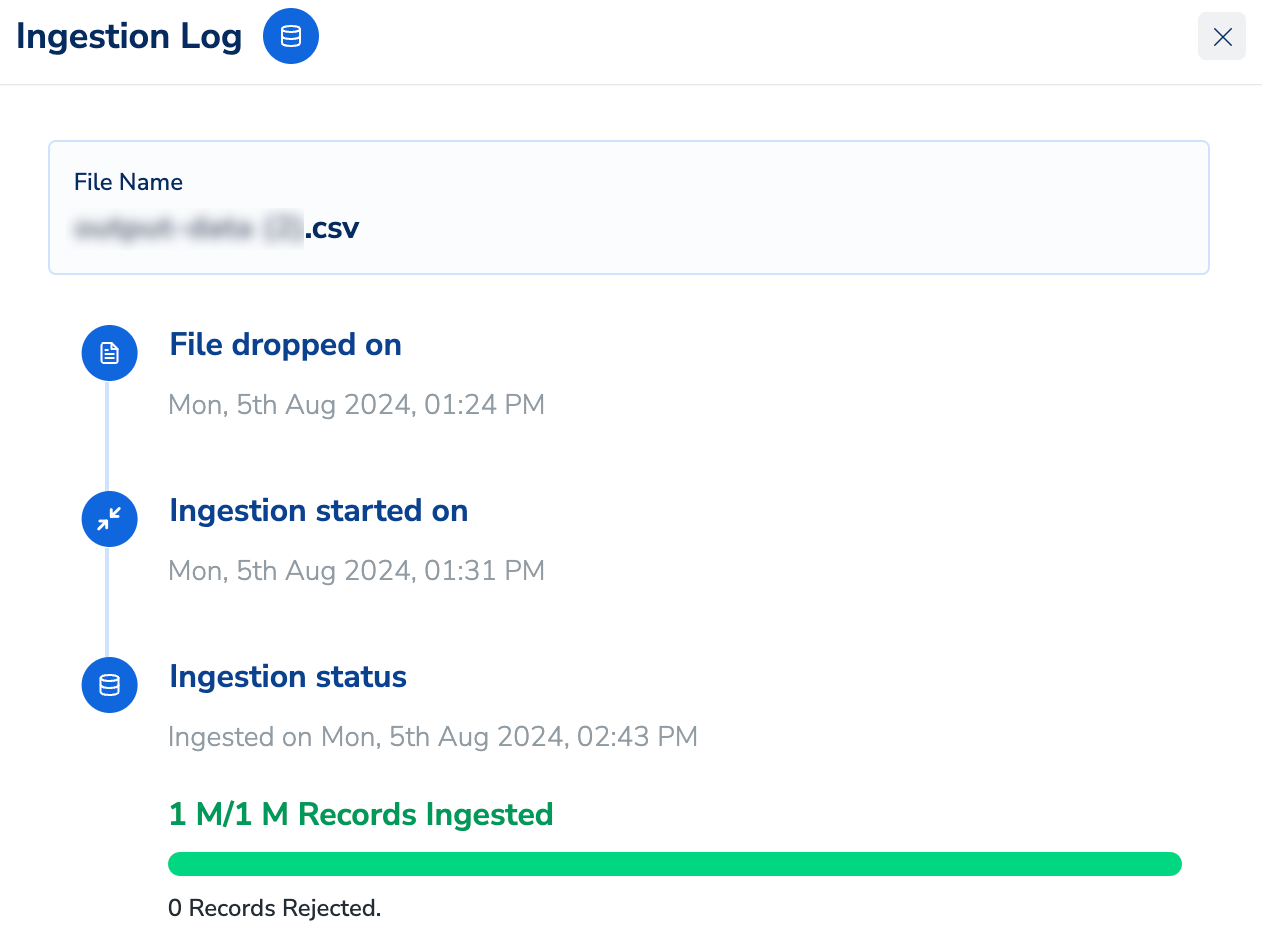
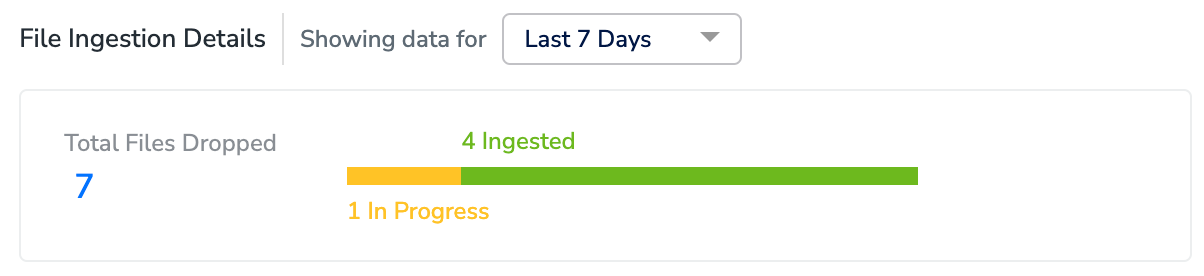
Panel 2 – File Ingestion Details
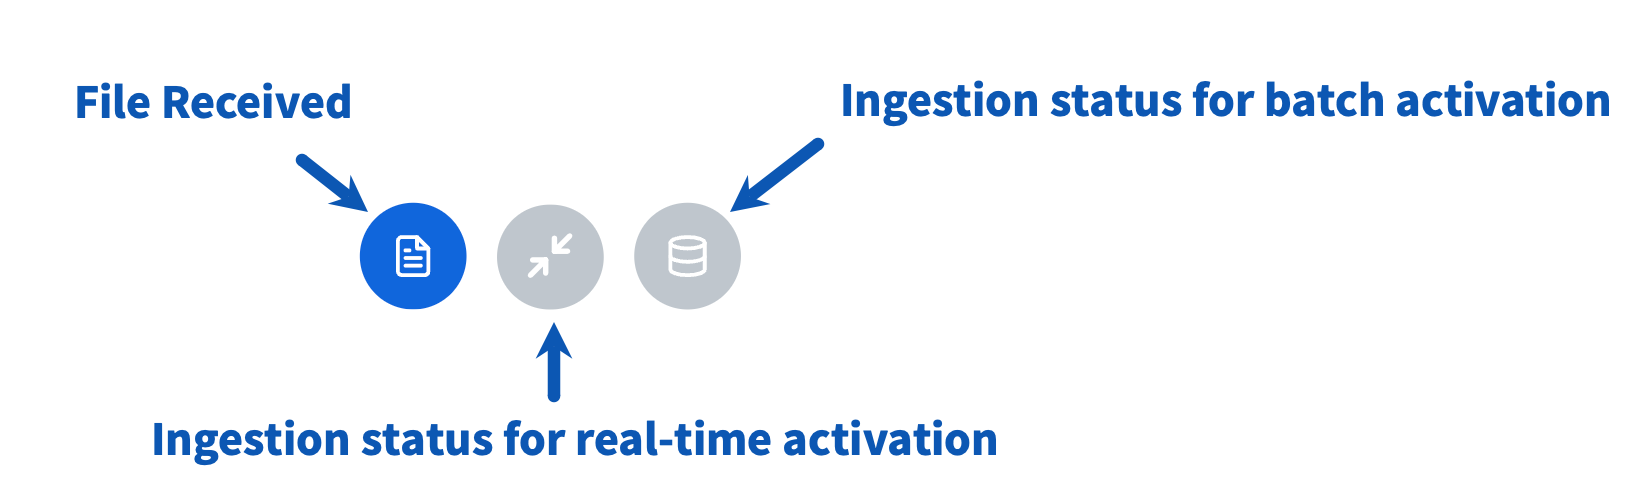
The File Ingestion Details panel provides information about the file name, the status of ingestion for both real-time and batch activations, the count of records ingested versus the total record count, the file size (for flat files), and logs related to the ingestion process. This panel is only visible for batch data sources where data is being shared in files.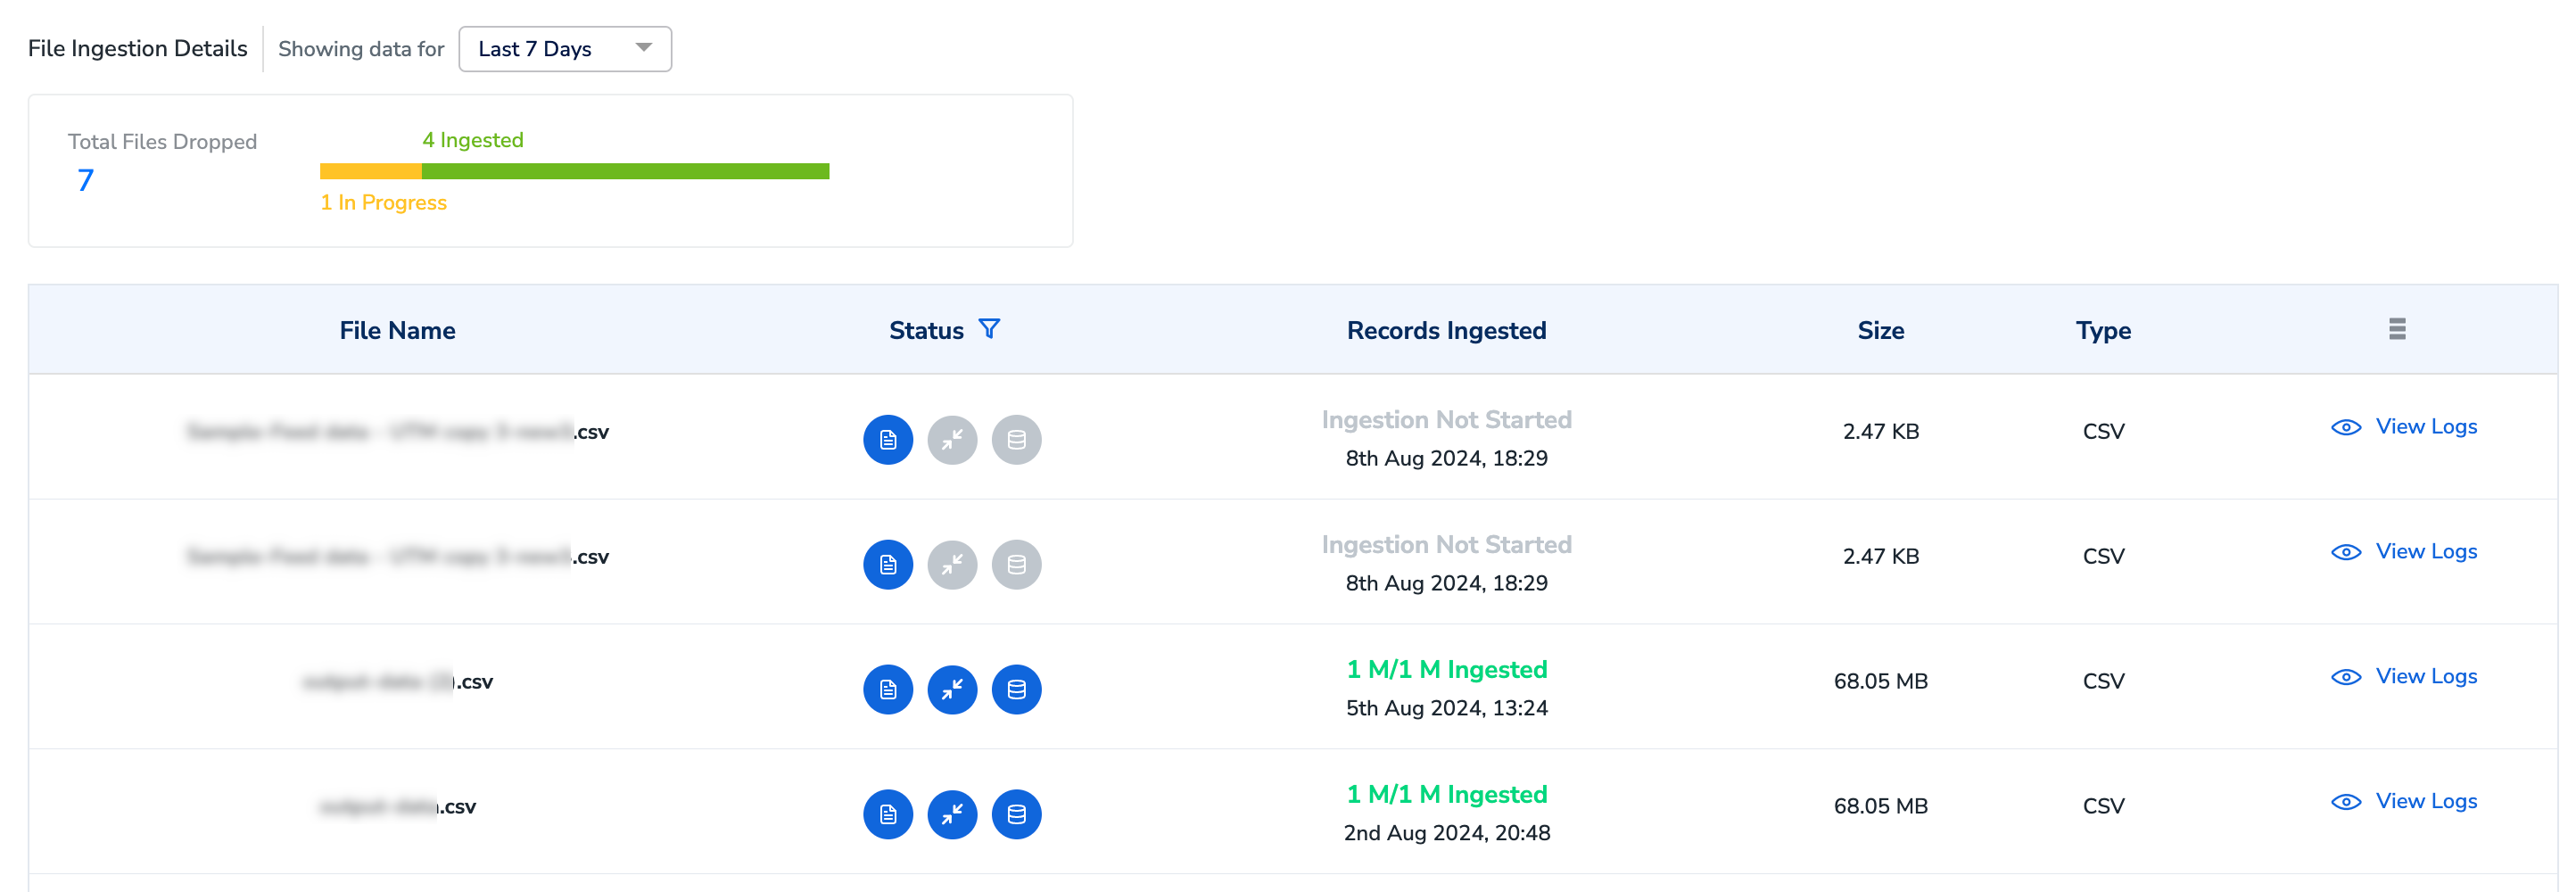
For batch sources, ingestion of each file will begin within 15 minutes from the time the source is mapped and the file is successfully dropped. | |