| COLUMN | DETAILS |
|---|---|
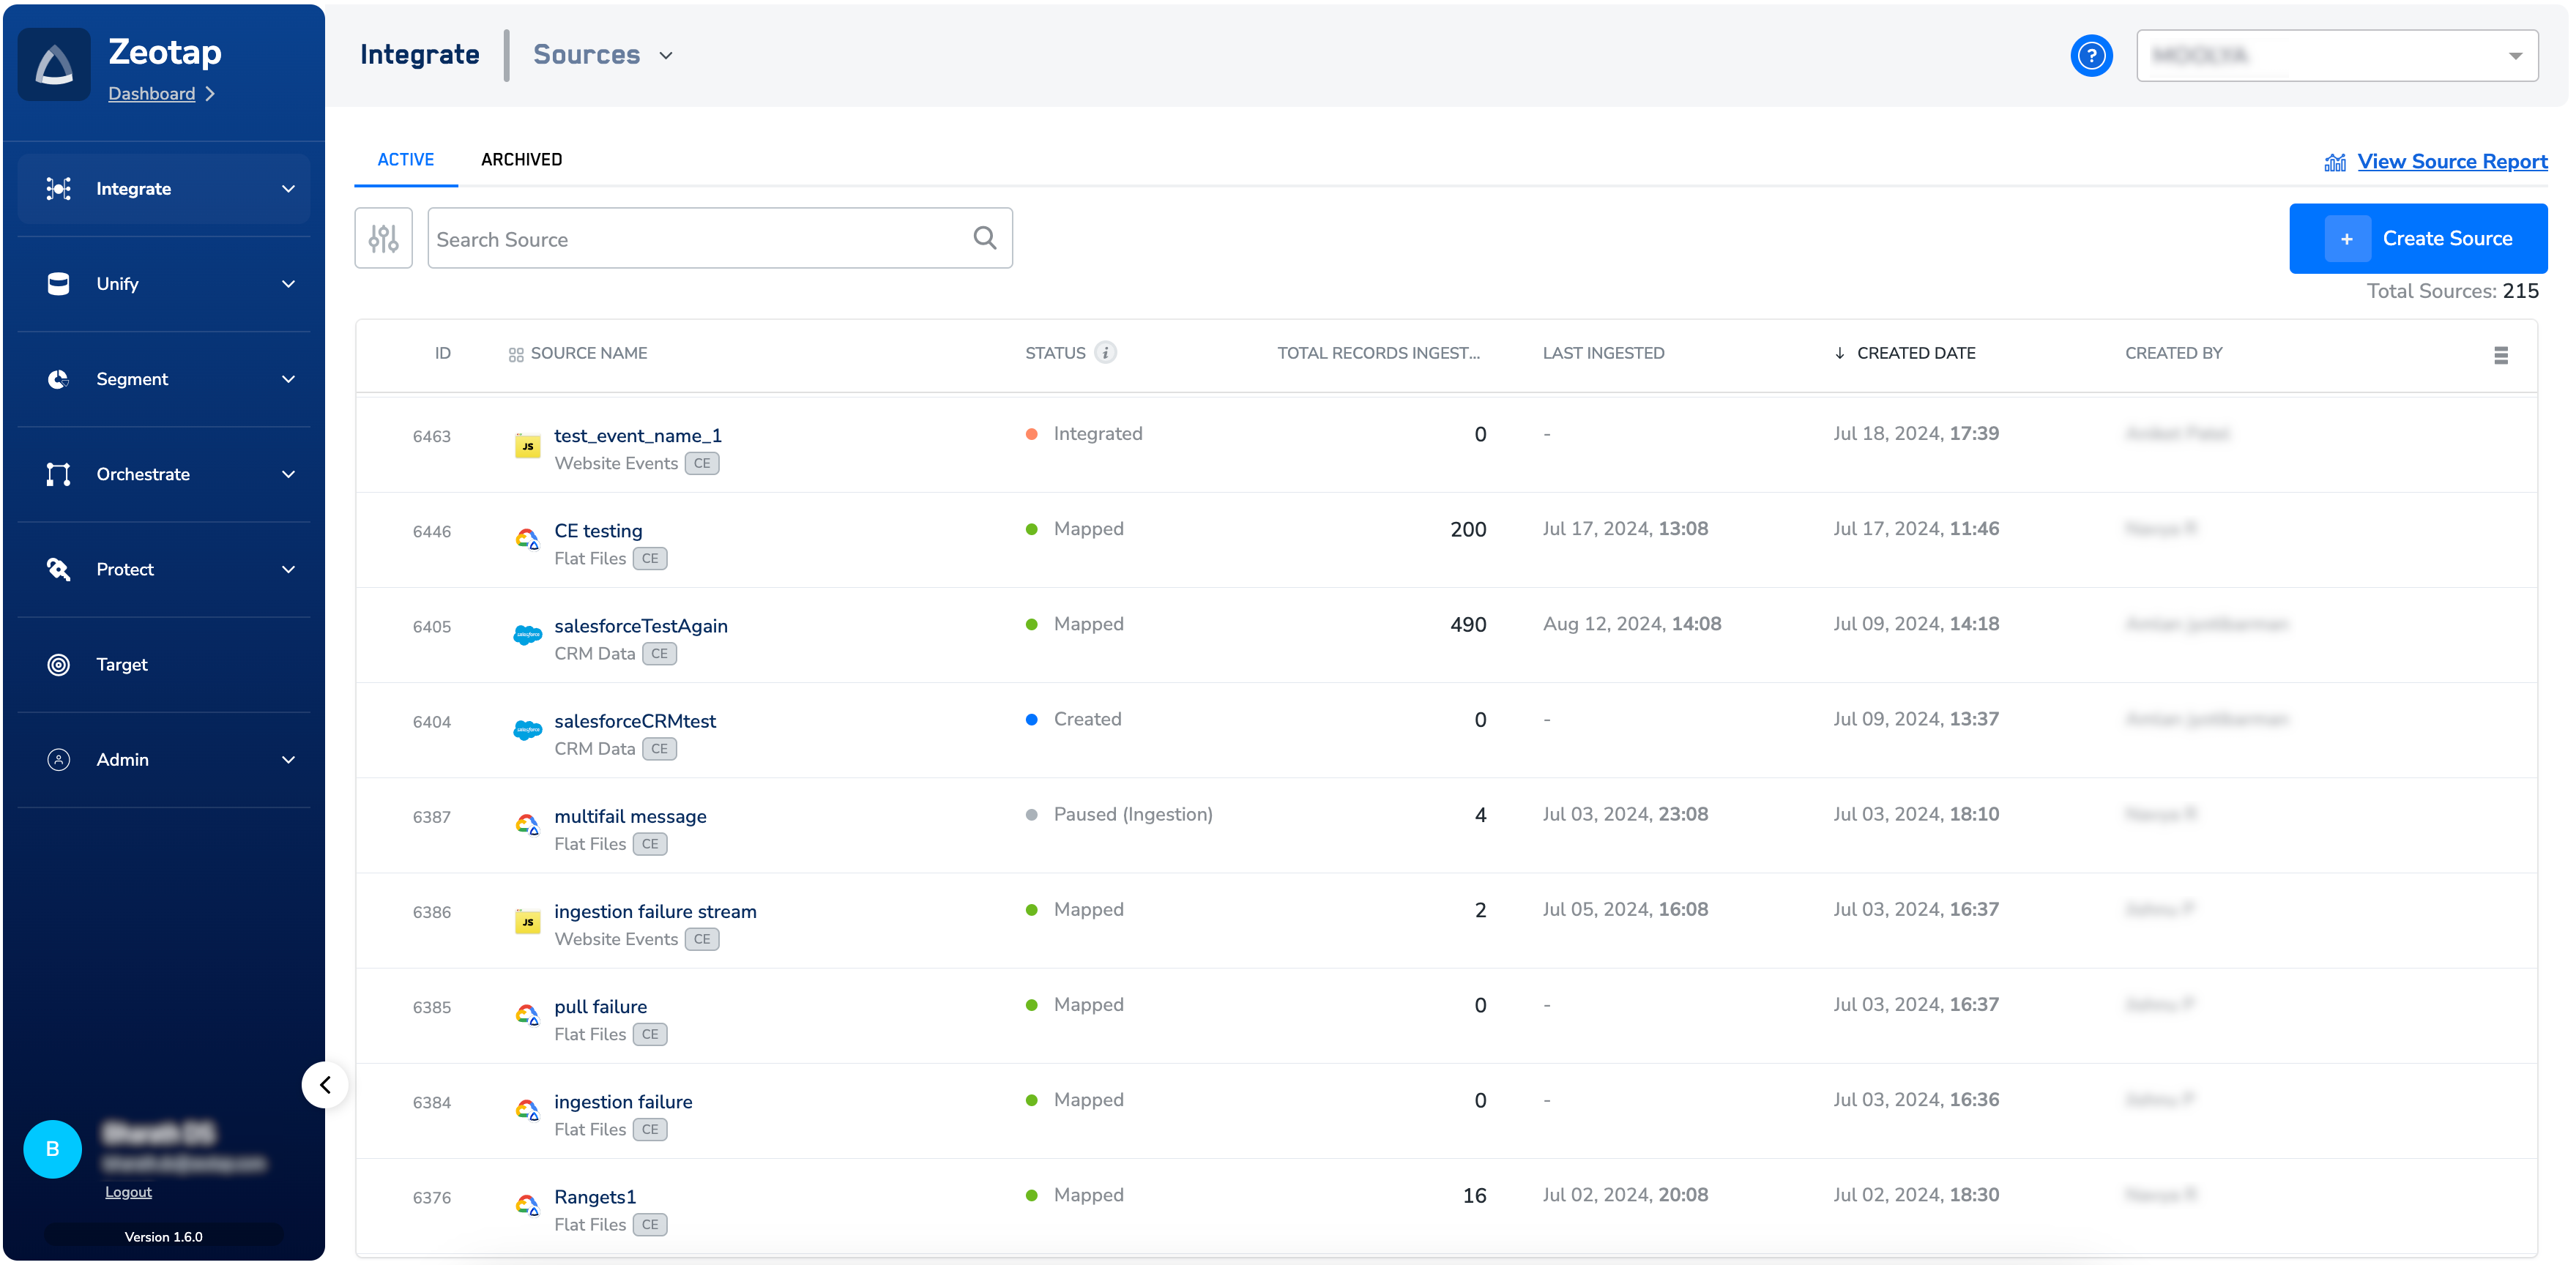
| ID | The ID is associated with the source and is auto-generated by the system. |
| SOURCE NAME | The name of the source as provided by you. Along with the source name, the following two details are also visible: Category – An icon indicating the source category appears beside every source. Data Source – The Data Source appears under every source name. For example, Flat File, Website Events and so on. Data Entity – The Data Entity tag appears besides the Source name. Depending on the data type, it can be either CE or NCE. Note: An alert icon appears beside the source if any erroneous record is ingested in the last 90 days. This alert remains until the errors are fixed. In case of flat files, the erroneous files are deleted and replaced with the correct files. |
| STATUS | The status of a source. The following are the available statuses: Created – Indicates that the source has been created in Sources, but it is yet to receive any data. Integrated – Indicates that the data has started flowing into the source, but the taxonomy standardisation is yet to be applied. At this point, you can preview the incoming data through the PREVIEW DATA tab of the particular source. Mapped – Indicates that the data collection(s) are created on top of an integrated source based on the common taxonomy. This means that at least one data collection exists for this source. Archived – Indicates that the source is archived for future ingestion. To know more about archived sources, refer to Archived Source. Paused – Indicates that the source is paused temporarily for both data collection and ingestion. Paused (Collection) – Indicates that the source is paused temporarily for data collection. Paused (Ingestion) – Indicates that the source is paused temporarily for data ingestion. |
| TOTAL RECORDS INGESTED | The total record count of the data ingested and are available for activation from this source. On hovering over the number, a pie chart appears with the following details: Ingested – The total number of records ingested and are available for activation. Failed – The records that failed to ingest during ingestion. Ingestion Efficiency – The percentage of the total records ingested versus the total records received (for the ingested records). Last Refreshed Date – The last date and time when this information in the pop-up was updated. 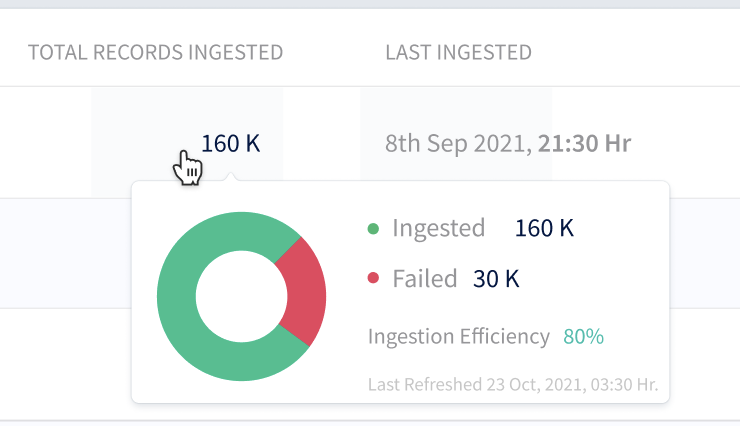 Note: The data displayed here is for the lifetime of the source. This means that the data displayed here is from the time the source was created in Zeotap. |
| LAST INGESTED | The timestamp of the last fully processed (ingested) record/file for this source. |
| CREATED DATE | The date when this source was created. |
| CREATED BY | The user ID of the users who created the source. |
| ACTIONS | Click the three dots to choose an action from the drop-down menu. Based on the status of a source, you can pause, rename, archive or edit the mapping for the source. You can also pause data collection, pause data ingestion, resume data collection or resume data ingestion, depending on the source type and status. Note: - Pausing data collection invalidates the write key on the source page, stopping data collection. To avoid errors on the source page, remove the tags before performing this action. - Pausing data ingestion and data collection for a source moves the source to the Paused state. - Saving the mapping for a paused source moves the source to the Mapped state. |
| VIEW SOURCE REPORT | Click the View Source Report button to view the complete data journey and record status information for each source in one place through the followings charts: Note that the dashboard refreshes every 8 hours. Chart 1 - The Source Ingestion Trend chart visualises cumulative event data over time. The y-axis represents the total number of events (cumulative), and the x-axis shows the start of the week. The chart data is based on ingested records. The chart supports filtering for the last 7 days, 30 days and 90 days to meet specific needs. You can also download the chart information in CSV format based on the selected filters.  Chart 2 - The Batch vs Streaming Ingestion Trend chart displays the count of ingested events over time. The y-axis represents the number of ingested events, and the x-axis represents the date. The chart distinguishes between two types of data sources: Batch Sources and Streaming Sources  Chart 3 - The Top Sources Ingestion Trend chart displays the number of ingested events over time for your top data sources. The y-axis shows the count of ingested events, and the x-axis shows the start of the week date. The chart reflects the top sources with the highest event counts. You can filter the chart to view the top 5, top 10 or top 15 sources based on cumulative ingestion records, giving you a “Top Sources Ingestion Trend” view.  Chart 4 - The Batch Sources Report provides detailed information about batch sources and their event data. The report includes the following columns: Date: The date the batch was received. Source Name: The name of the source. Source Type: The type of source (For example, Zeotap Google Cloud, SFTP, JS, Web pixel and so on). File Name: The name of the file ingested. Status: The current status of the batch. Received Records: The number of records received from the source. Ingested Records: The number of records successfully ingested.  |
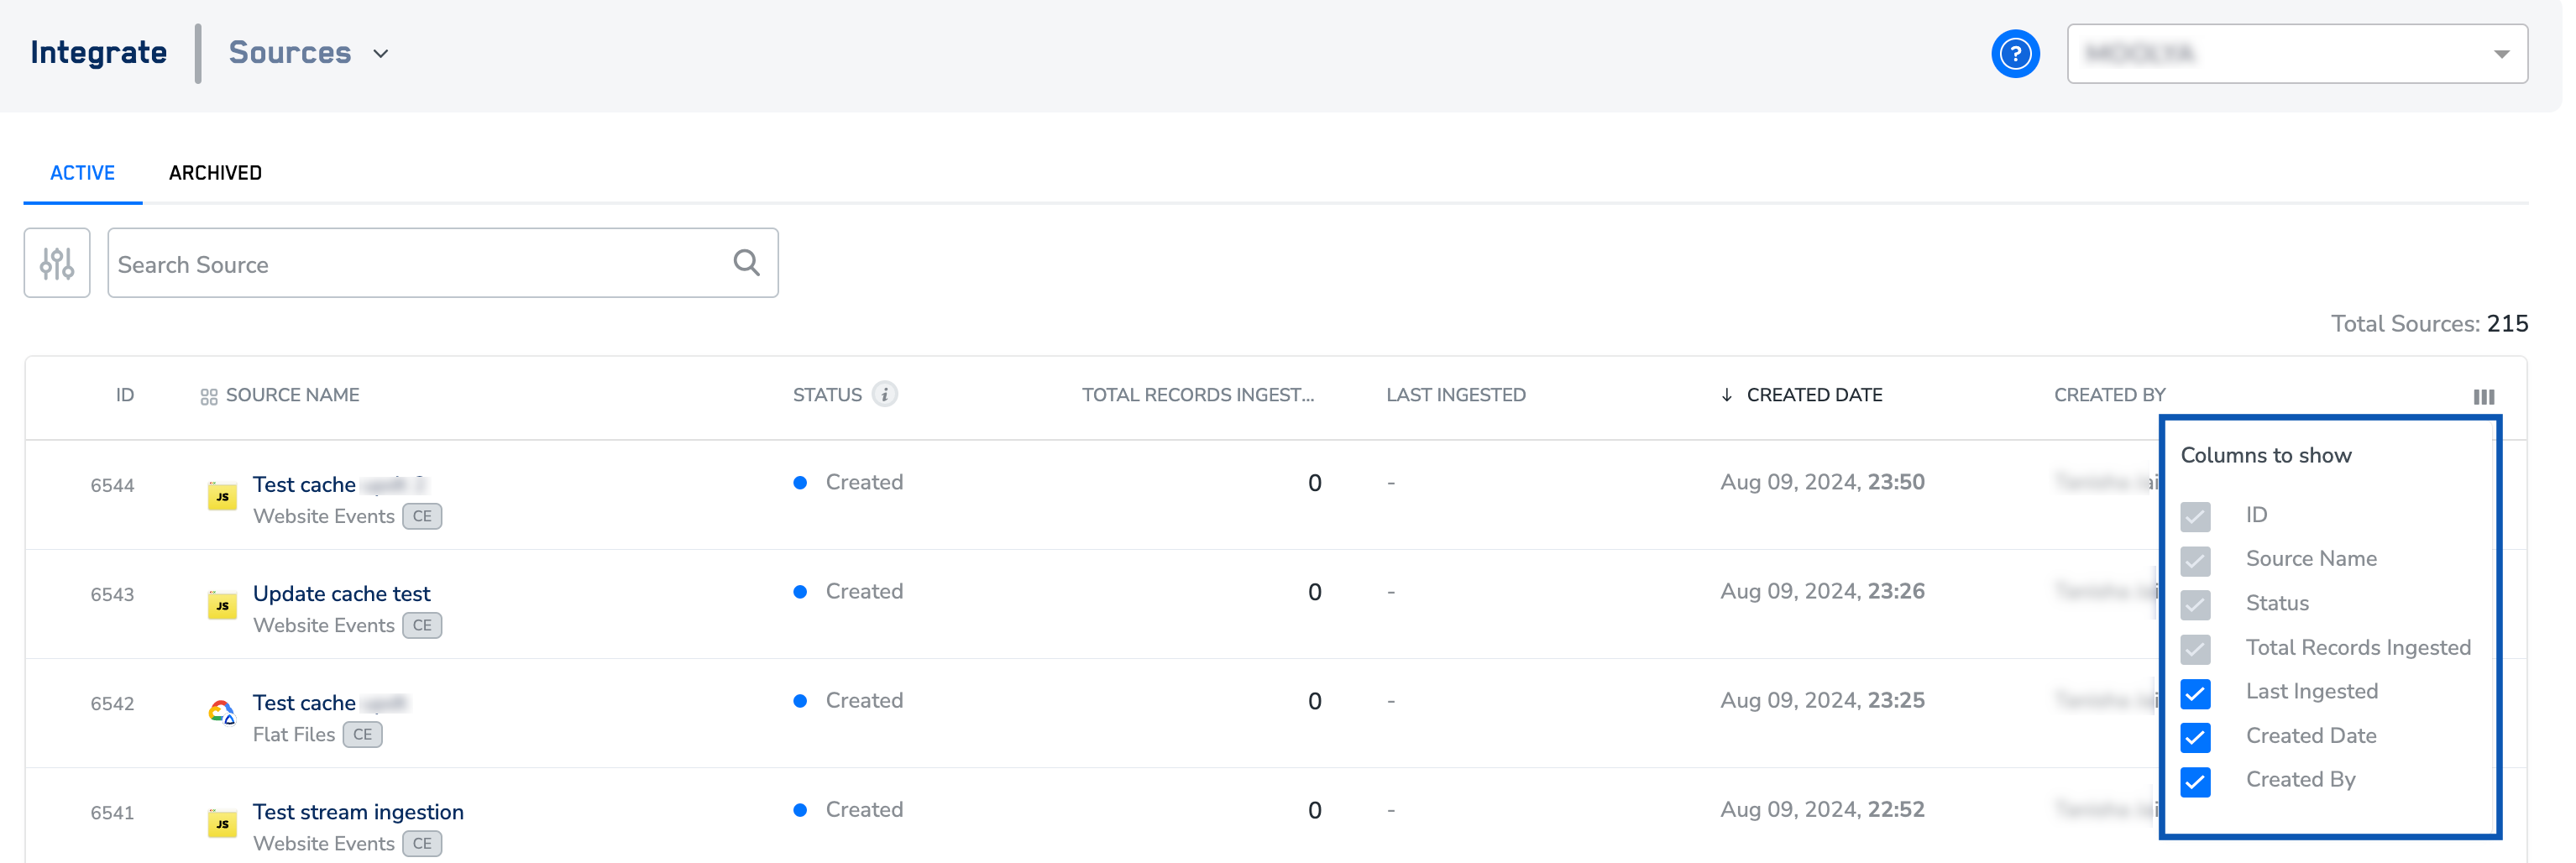
Table Column Selection