Panel 1: Summary Numbers
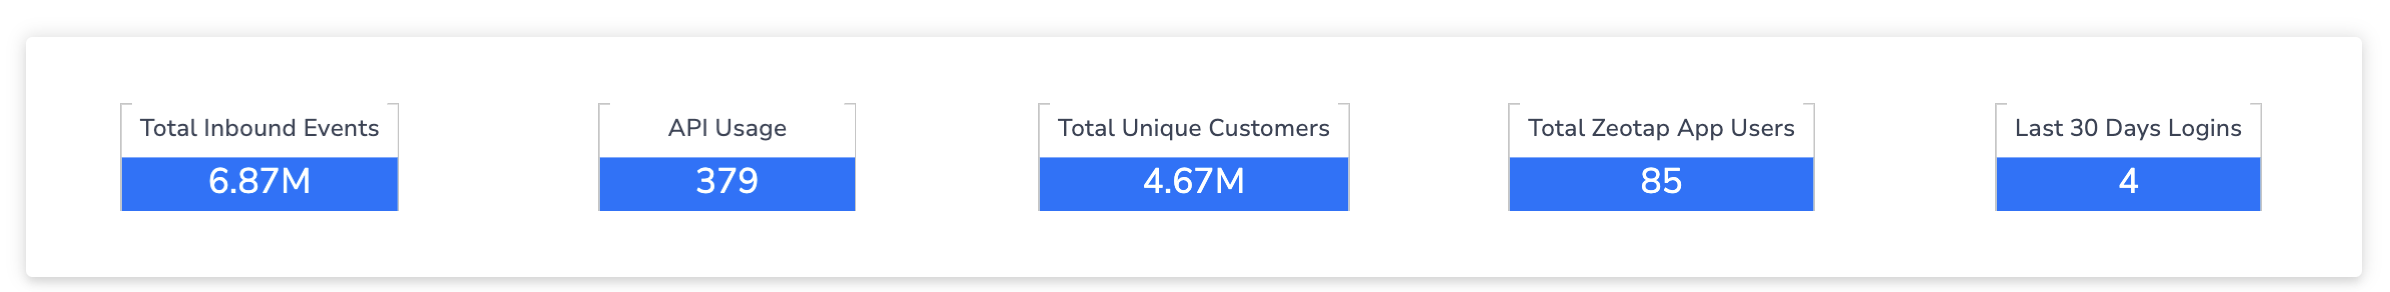
- Total Inbound Events – The total number of inbound events (streaming events + batch events + Profile API calls ) received since the account was created.
- API Usage – The total number of API calls made through the Profile API. This includes read, write and delete calls.
- Total Unique Users – The total number of unique users that are ingested into the Zeotap system since the account creation. The users are included in the Total Unique Users count even if they are deleted after ingestion.
- Total the Zeotap CDP App Users – The total number of the Zeotap CDP App users that are created under the account.
- Last 30 Days Logins – The total number of the Zeotap CDP App users that are associated with the account and have logged-in within the last 30 days.
Panel 2: Inbound Events
.png?fit=max&auto=format&n=cTmgcQYl-5jOouxf&q=85&s=ed467bde2a2f10f99259d861b6cb99c5)
- Total Inbound Events Breakdown: This chart shows a breakdown of the total inbound events by ingestion type and through Profile API calls, comparing real-time ingestion with batch ingestion and Profile API calls. You can choose the duration for which you want to view the data.
- Cumulative Inbound Events over Time: This chart shows a trend line of the ingested events and API calls over time. You can choose the duration for which you want to view the data and the grouping frequency at which you want to see it.
When the chart is grouped at weekly frequency, the X-axis shows week of the year and the Y-axis shows the total volume of events ingested until that point.
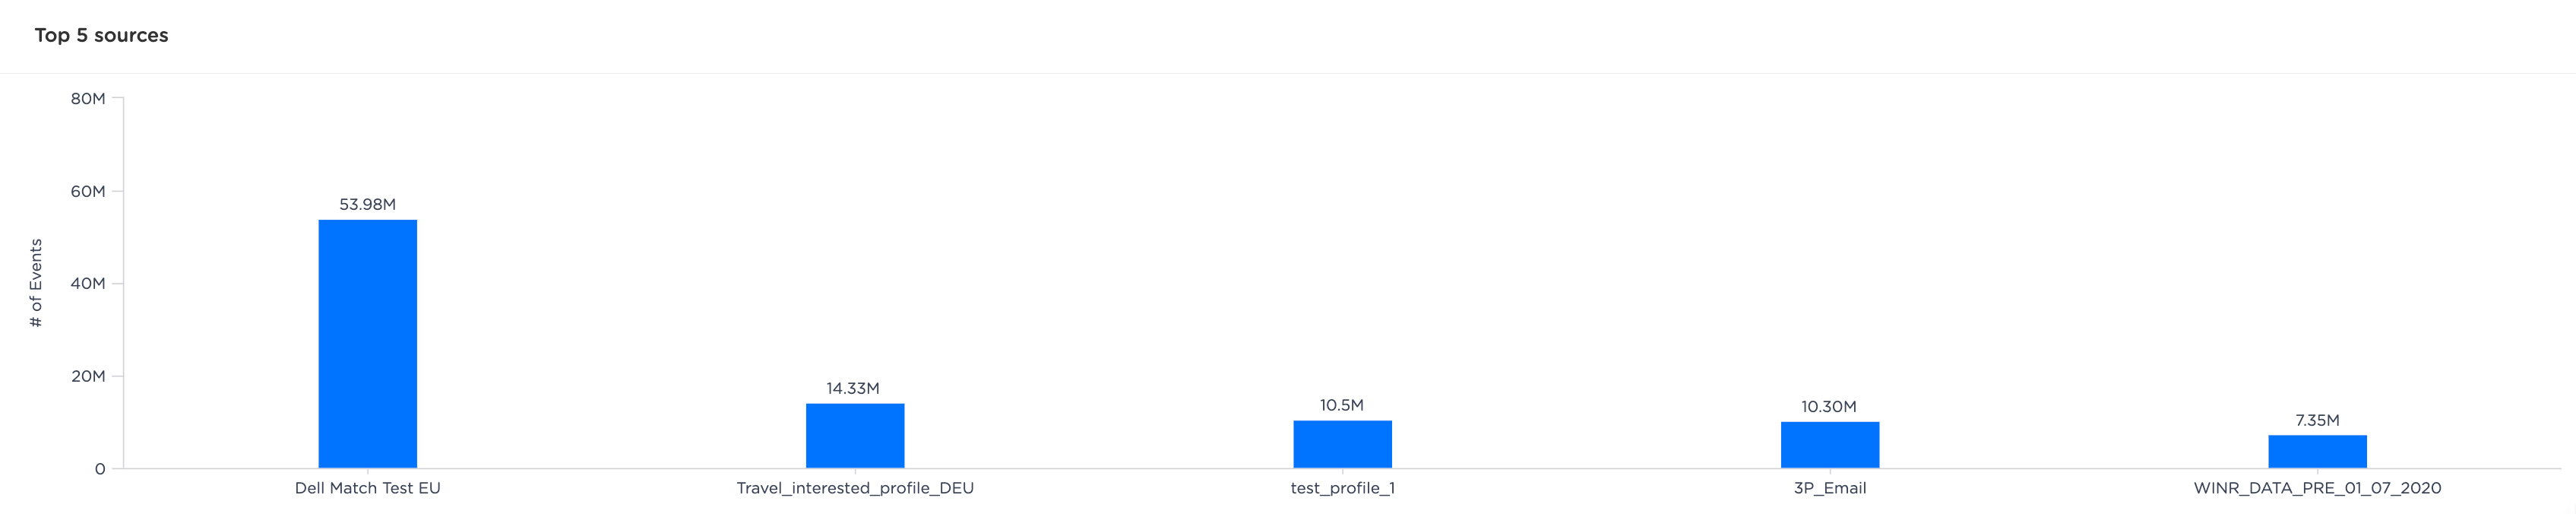
Panel 3: Top 5 Sources
Panel 4: Connect Segments
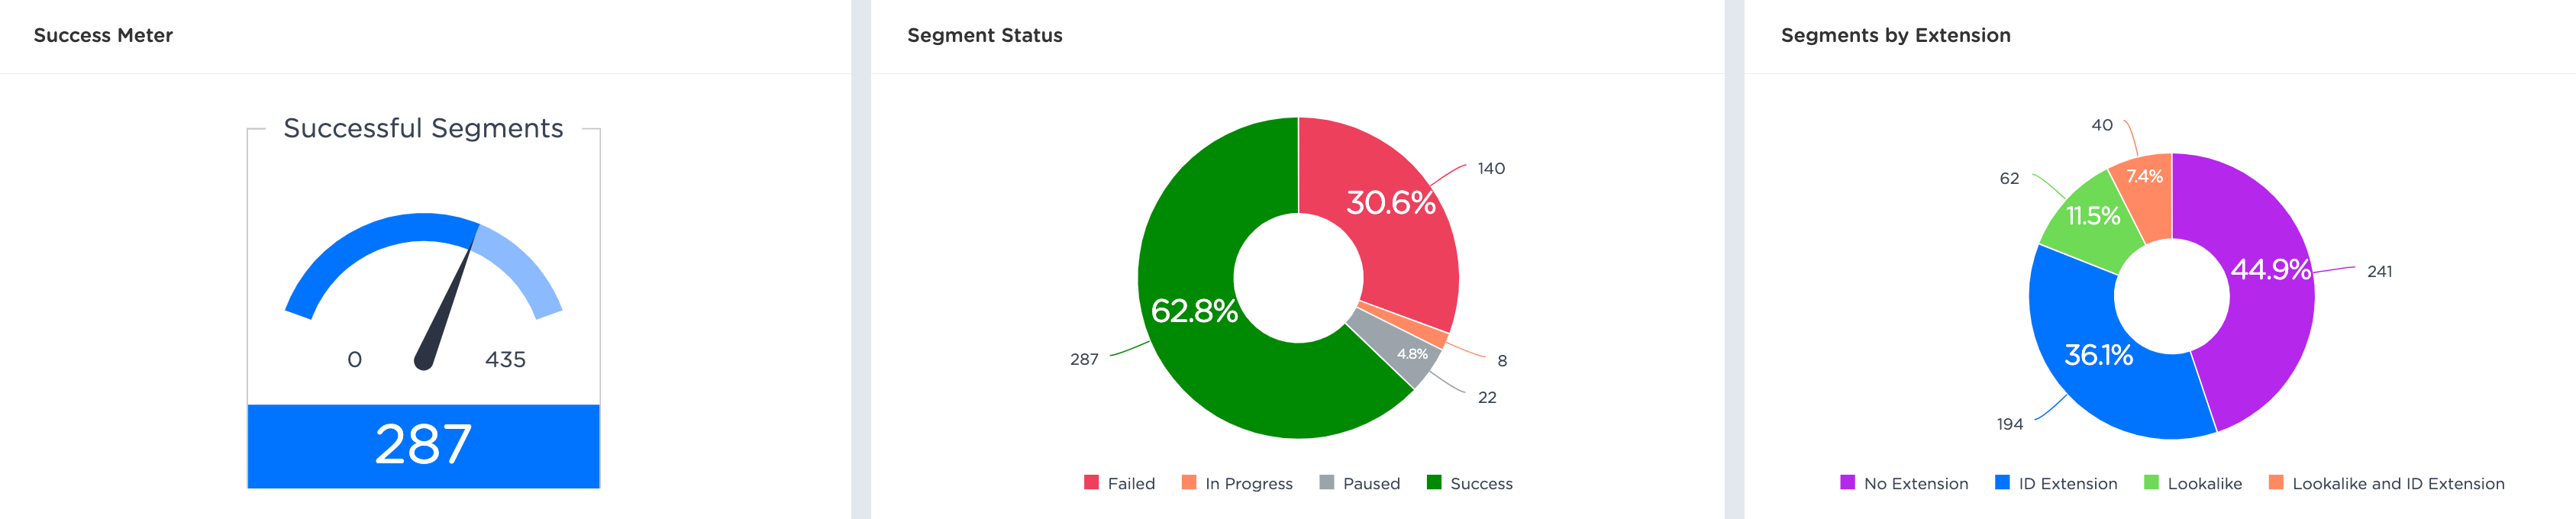
- Successful Segments: This chart displays the number of successful segments against the sum of successful and failed segments. This shows the success rate of segments.
- Segment Status: This chart shows a detailed view of all the segment statuses for segments created under an account.
- Segments by Extension: This chart shows a breakdown of segments by extension for all segments created under an account.
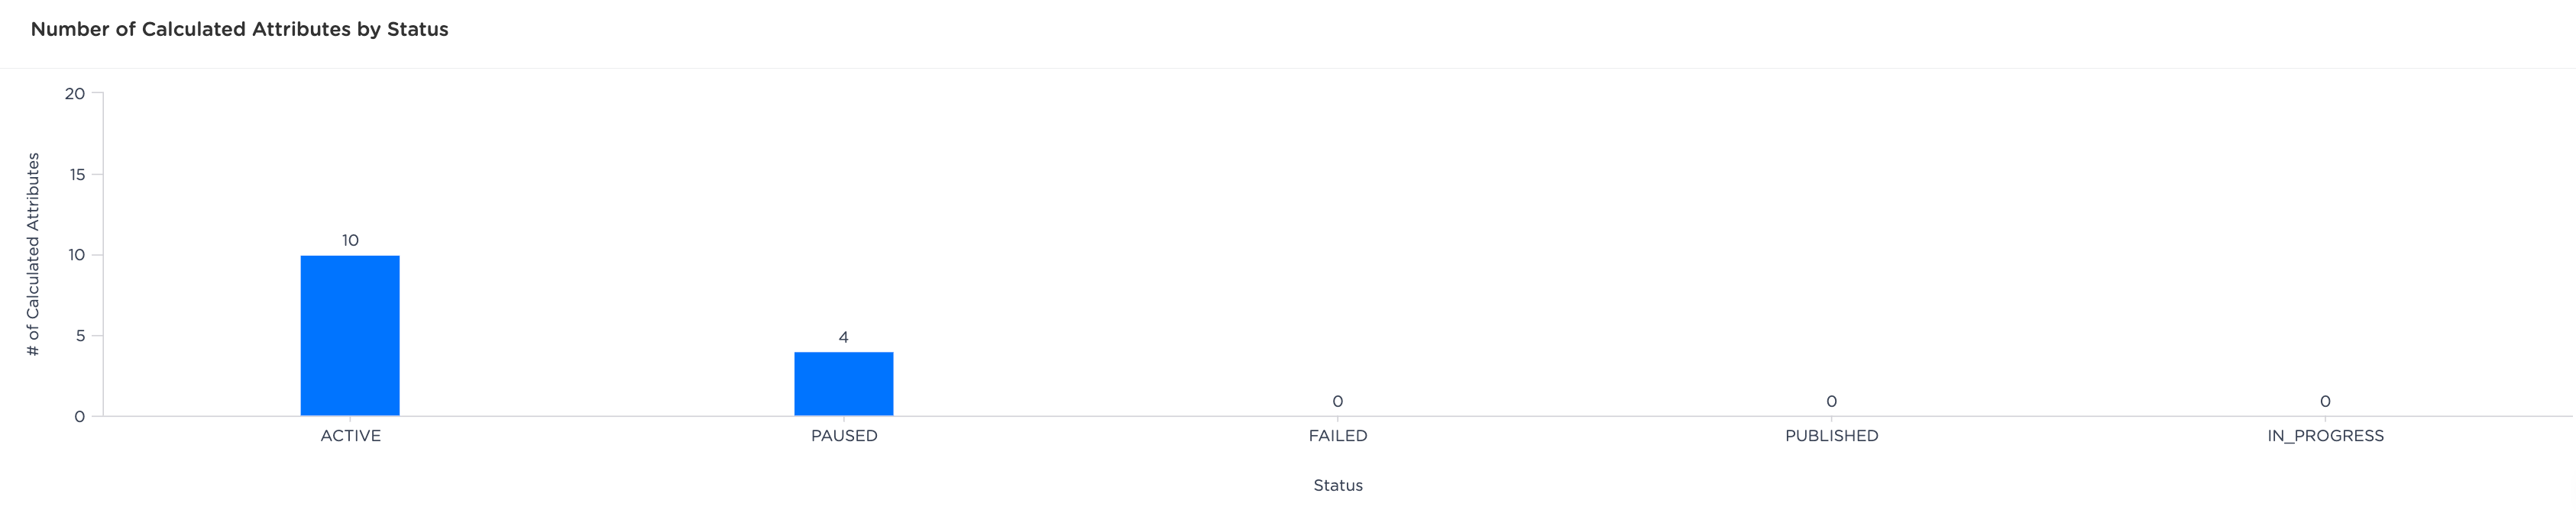
Panel 5: Calculated Attributes
Panel 6: Symphony Workflows
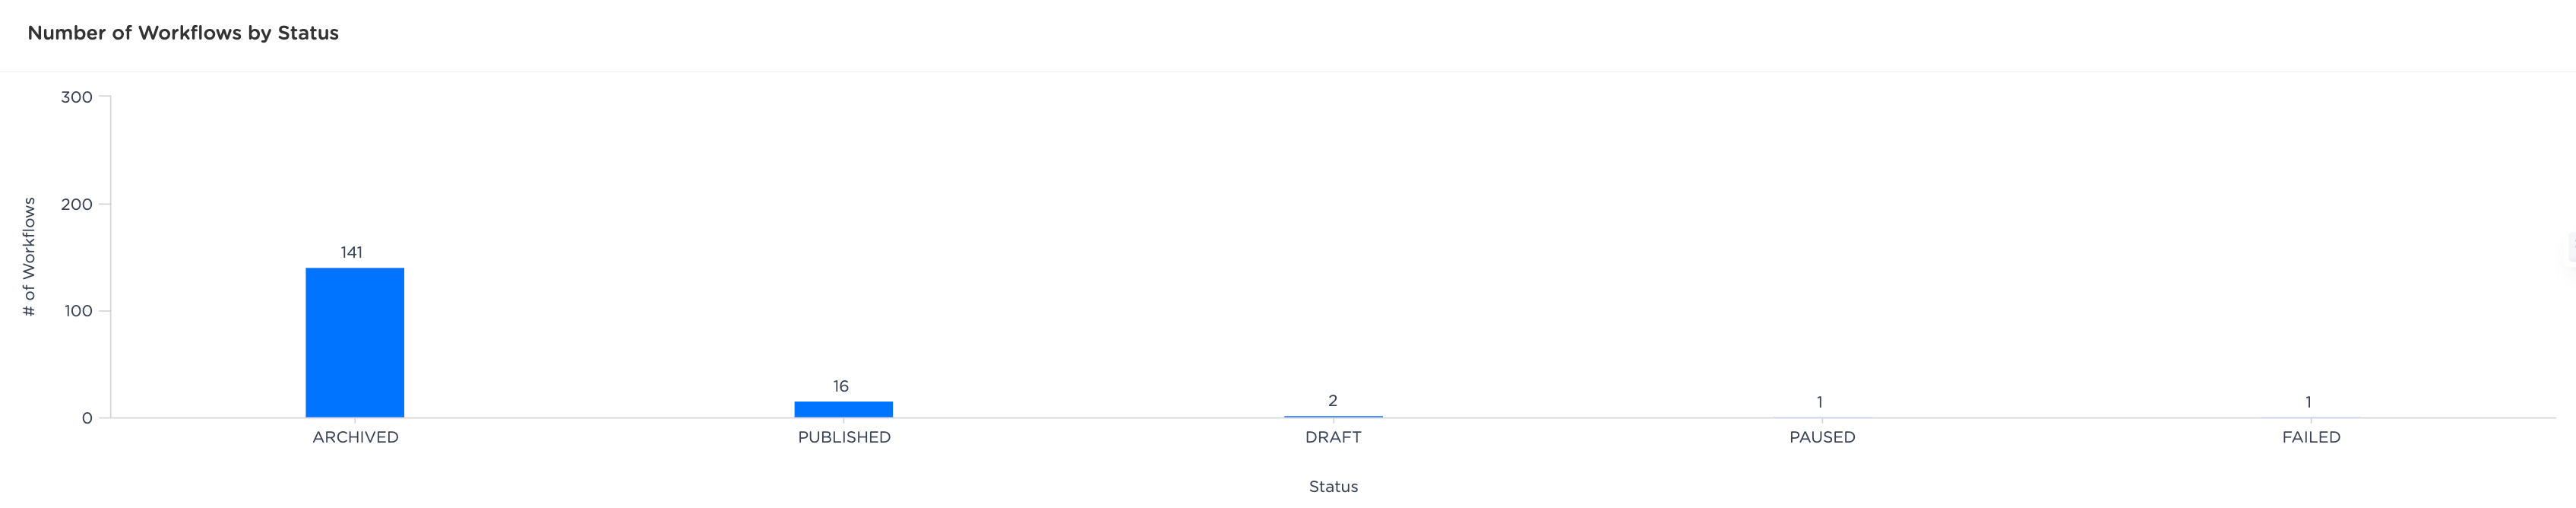
-
If there is no data available for the duration that you’ve chosen in the above mentioned charts, then the
No Data to Showmessage is displayed. - If your account does not have access to a particular product, then a message to upgrade to the respective product appears on that chart. Reach out to your CSM to upgrade.